

Hi Multis
Every week, I’m happy that I can write the Overview Of The Week and I know many of you are delighted to read it, a great win-win.

Tomorrow, it’s the 15th and that means I will release the Best Buys Now, just like every month on or around the 15th.
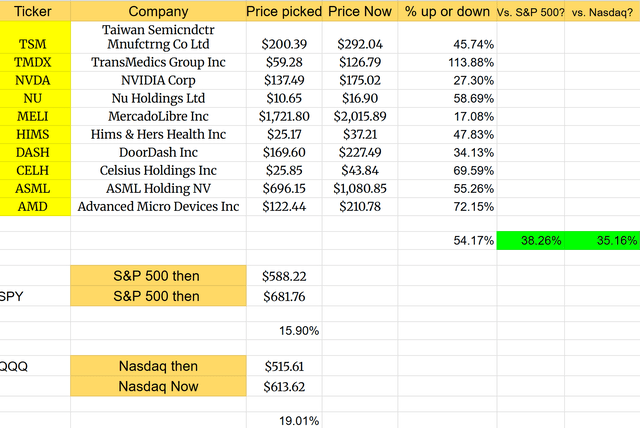
The end of the year is nearing and that means that soon, you will also get the Top 10 Stocks for 2026. Despite the recent drop, the 2025 selection still goes strong, with 54.17% gains, beating the S&P 500 by 38.26% and the Nasdaq by 35.16%.
I have already been working on the new list, but things can still change, of course. The Top 10 picks for 2025 will be released in the last week.
Are you sick of missing these kinds of returns?
Get full access to Potential Multibaggers. Here’s what you’ll get:
✅ Best Buys Now (outperforming the market by 20% over 3 years!)
✅ My Top 10 Stocks for 2026.
✅ My complete portfolio (with every transaction)
✅ Deep insights through quarterly earnings deep dives
✅ The Quality Score and valuation updates every quarter.
✅ Access to our private chat group
Don’t hesitate. Don’t miss the next multibagger opportunity!
Articles In The Past Week
This is the third article this week. The two previous ones together form a Latin American party.
In the first article this week, we analyzed Mercado Libre’s most recent earnings and looked at the PM Quality Score and Valuation to know if the stock is a buy right now.
In the second article, Karan (a banker) analyzed Nu Holdings’ most recent earnings, as only he can. I used a new valuation method for NU. You can read everything here.
Memes Of The Week
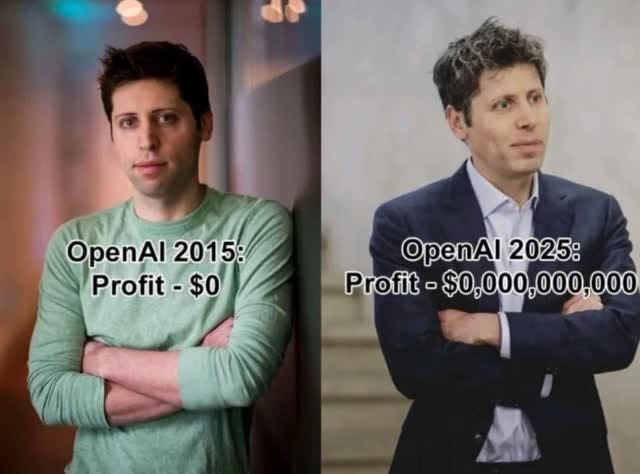
Two memes this week. This is the first.
And this is the second.

Interesting Podcasts Or Books
This week, I’m pitching myself here, haha. Speedwell Research interviewed me last week and this week, the podcast episode was released.

I already got so many positive reactions. Thank you all. You can listen to the episode here.
The markets in the past week
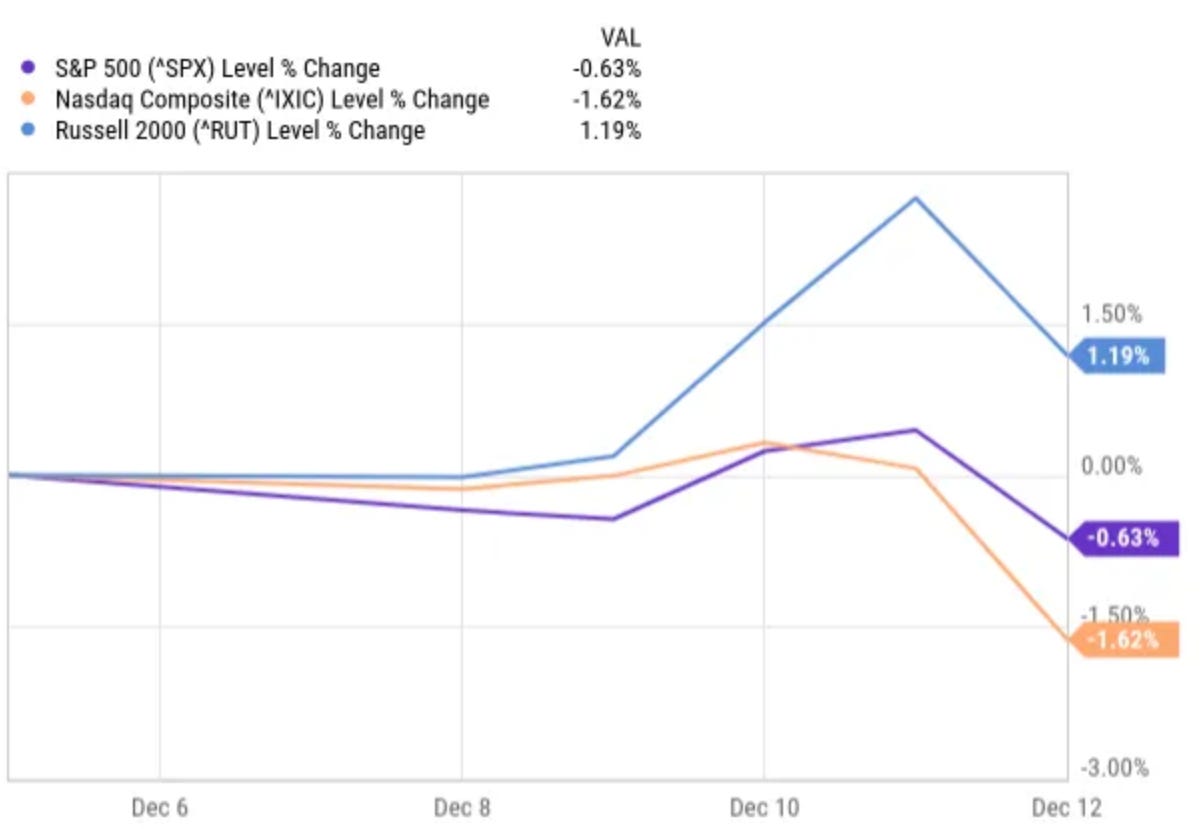
It was a bit of a strange week in the markets. The S&P 500 was 0.63%, the Nasdaq even fell 1.62%, but the Russell 2000 was up 1.19%.
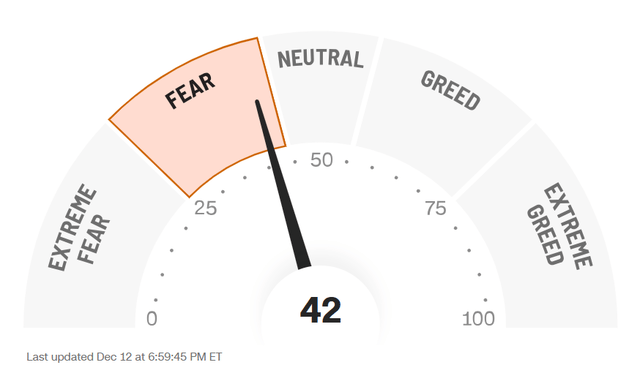
The Greed & Fear Index remained in Fear territory.
Lesson Of The Week
It was already in the podcast episode, but I am not a big believer in DCF models. Why?
Well, first because of this.
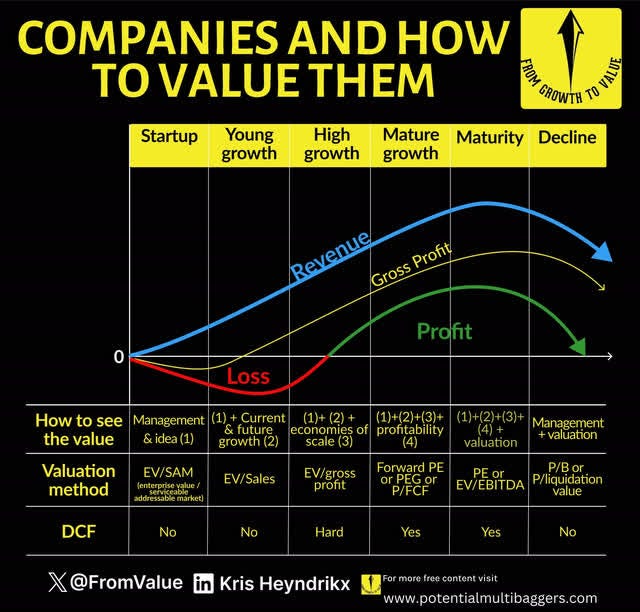
The bottom line shows you where I think a DCF makes sense. I think it only makes sense in mature growth and maturity, not for any other stages.
Of course, there are the DCF prophets, and there are many, and they often react indignantly to statements like this.
I listed 5 DCF flaws here.

This was a reaction of a former investment banker.
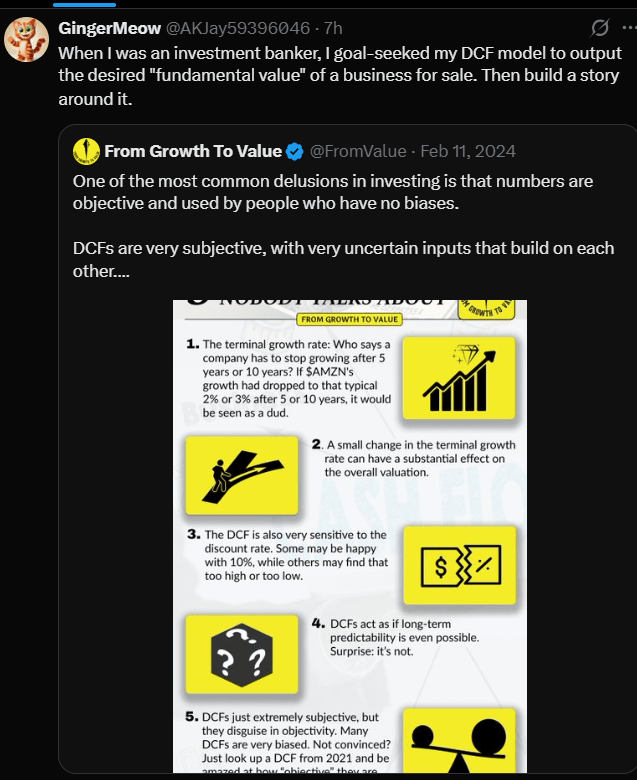
Unfortunately, that’s very often how it goes. As some say in the business: “Give me what you want and I’ll give you the DCF.” The inputs are so sensitive that it often makes little sense to attribute too much credibility to a DCF.
Now, don’t get me wrong. I don’t say they never make sense. Especially for mature companies, they are one of the better ways to value a company. But the problem is primarily the credibility that most people give to a DCF. It’s just one of the many very subjective ways to value. But the precise outcome gives a false sense of accuracy.
If people use DCF for a mature company to give a wide range of what they consider a fair value and bring it clearly subjective (I think... I consider... If my assumptions are correct...) then I don’t have problems with DCFs, of course.
But too many investors bow to the altar of very subjective DCFs as if they are the almighty god of investing. They are not. They are a very sloppy exercise with expectations. And that comes from someone who doesn’t have a finance background, but studied the hard way how to do DCFs. I did many DCFs when I started out. They gave me a sense of accomplishment. Because, just like so many investors, I didn’t understand DCFs initially and having mastered them made me proud of myself. I felt like I had some sort of anchor, a tool that could help me conquer the uncertainty that investing has.
Forget about it.
On top of that, analysts give price targets.
It’s completely useless and ridiculous. I never give price targets and I never will. Please, never trust those targets and you will become a better investor.
Why are price targets ridiculous? Well, first, it’s totally impossible to know what a company is worth exactly. I already said the same with the DCF rant above. But secondly, the market as a whole is totally unpredictable. So, one uncertainty layered upon another uncertainty? That just gives a very lousy outcome.
If you want a price target, take your dartboard, write some prices around the current price on stick-its, take a blindfold, make sure you don’t see anything and throw your dart. There, you have your price target, as reliable as that of analysts.
I talk to analysts regularly and many feel the same about price targets. But they have their bosses want them to give price targets. Why? Because that gives the covering company free press coverage. Without price targets, no free press. It’s as simple as that.
So, please ignore all price targets and be careful with DCFs.
Quick Facts
1. Todd Combs Leaves Berkshire Hathaway
This week, it was announced that Todd Combs would leave Berkshire Hathaway. To most people, including me, that was a surprise.
Todd was half of the Ted & Todd investing twins at Berkshire for 15 years with Ted Weschler. Here you can see them, with Todd Combs on the left side.


Source
Todd Combs also led GEICO, one of Berkshire Hathaway’s crown jewels.
There was a big difference with how the press has always reported about Todd Combs and how many reacted online. Up to now, I had a positive image about Todd Combs, simply because he worked for Berkshire.
But there were many online reactions that were very negative. Here are a few Edwin Dorsey (The Bear Cave) collected.


One commenter even posted this:

Sean Combs is the real name of P Diddy and you know how what happened there...
Is it Buffett who pushed Combs out in a last move or Greg Abel? We don’t know, but there’s a whole shake-up at Berkshire.
2. Not The Dotcom Bubble (yet?)
This week, I saw this great chart.

So, no, this is not the dotcom bubble yet. Back then, many of the biggest companies were valued much higher. Of course, Tesla and especially Palantir are valued absurdly but that doesn’t go for the rest.
There’s a ton of negativity now around AI. See the Oracle drop after the earnings, for example. But that’s healthy for the market. I don’t believe there is an AI bubble yet and these corrections are healthy.
3. What If ... The Market Is Cheap?
Today, I got this chart from one of the sharpest minds in investing I know.
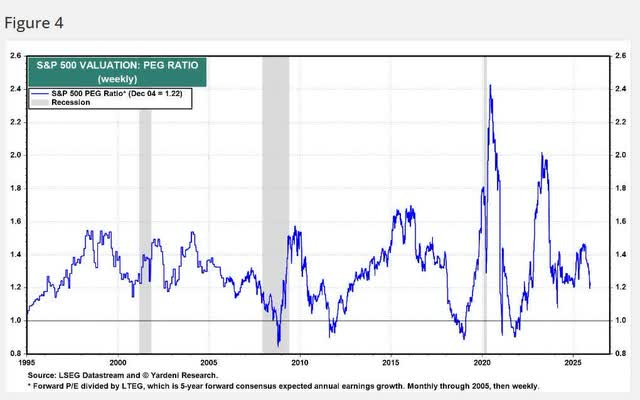
He is more someone who asks questions and shy about providing answers, so he sent it without comments. But I think this could shed additional light on the market valuation.
Now, don’t get me wrong, I don’t claim that the chart has predictive powers. The market is unpredictable. From 2005 to 2007, this indicator didn’t flash a red light. The big crash was not because the market was overvalued but because of the junk house loans that collapsed and almost ended the financial system.
In 2019, the forward PEG was very low, but then the pandemic hit and that immediately had an impact on the E (earnings) and G (growth).
So, it’s what I have been saying for a long time. Growth should be factored into the market. If the biggest companies grow their earnings so fast, it’s not weird that earnings grow and growth is rewarded.
At the same time, if you look at 2000, you could also that the PEG looked reasonable, so this might not be the best indicator. All in all, it’s just one element we can use in a broad puzzle that’s very hard (impossible?) to make.
4. Revenue Growth or FCF?
I have shared this graph many times before.
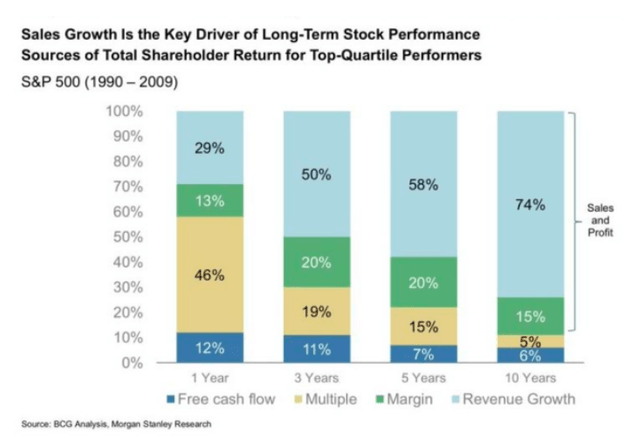
It’s one of the most important charts in investing. It shows that valuation is extremely important for 1-year returns (46%). But over 10 years, Revenue Growth contributes to 74% of the total return. If you add margins, you have 89%.
Someone argued that the Quality FCF aristocrats did better. He posted this chart.

Now, what are Quality FCF Aristocrats? There’s no clear definition, but usually, these elements are involved:
10+ years of rising FCF
Growing margins
High ROIC (return on invested capital).
Wide moats
Strong balance sheet
But this only proves the point. FCF Aristocrats have growing margins, which is the second-most important metric to grow according to the chart I gave you.
But secondly, Quality FCF Aristocrats grow their revenue roughly 2× the S&P 500 and 3–5× faster than Value, Dividend, or Low Volatility factors. So, the point still stands. If you look at FCF growth with lower revenue growth, the returns are just not that good.
Here, the free part ends.
Get full access to Potential Multibaggers. Here’s what you’ll get:
✅ The rest of this article
✅ Best Buys Now (outperforming the market by 20% over 3 years!)
✅ My 10 top picks for 2026
✅ My complete portfolio (with every transaction)
✅ Deep insights through quarterly earnings deep dives
✅ The Quality Score and valuation updates every quarter.
✅ Access to our private chat group
Don’t hesitate. Don’t miss the next multibagger opportunity!