

Hi Multis
Yesterday, I was a speaker at the VFB Conference in Antwerp. You can see a picture here that Multi Frederic sent me. Thank you very much for that pic. It’s the only one I have so far. There were multiple professional photographers, but it takes a while before I will have those pictures.

There were 2,000 investors there and I spoke with many people. Overall, the sentiment is really negative now.
I also spoke to some Multis who were there and came to me. Thank you for those great conversations. And what stood out to me is that Multis are wired differently. While the general mood was one of negativity about the state of the world and investing, Multis can see through the clouds. They are more optimistic.
Now, that doesn’t mean it’s easy for Multis to invest now. We are all humans and that leads to conflicting feelings. On the one hand, many of you have seen this (and worse) before.
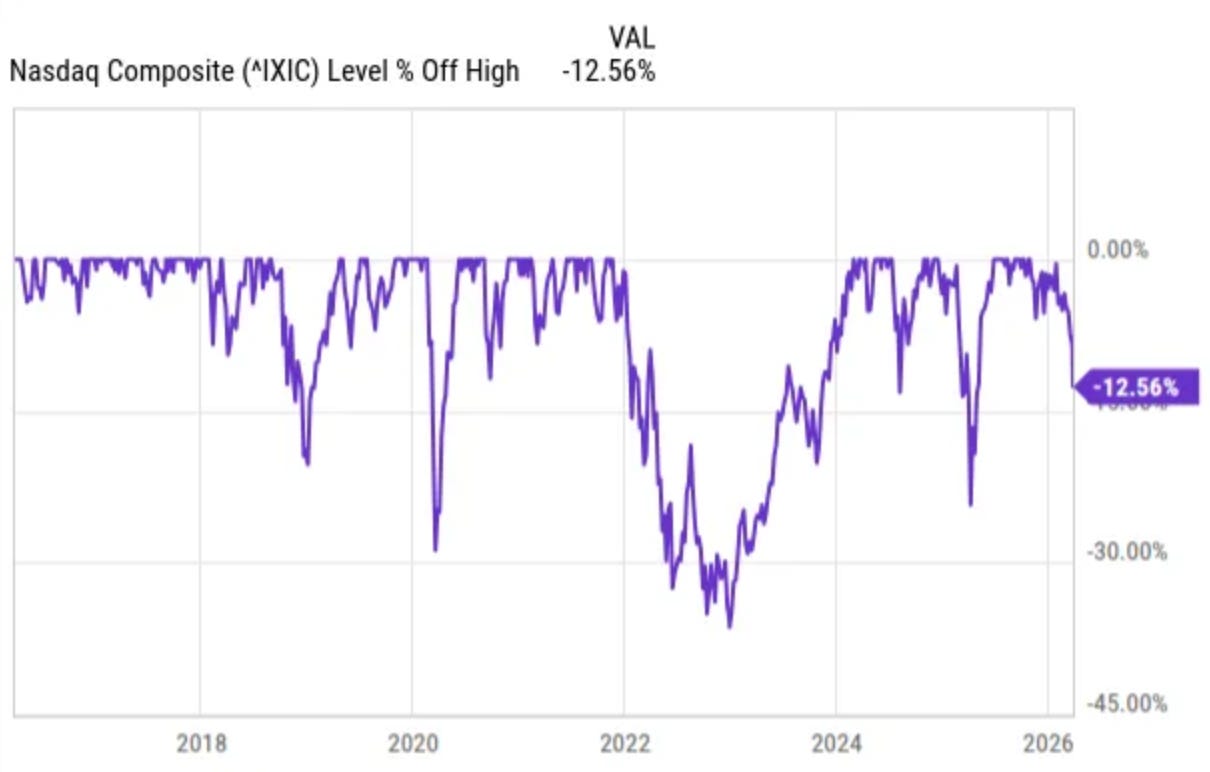
Sometimes, people seem to forget that in 2022, there was a crash for tech stocks. The Nasdaq as a whole was down 36%, more than during the Covid crash. Right now, the Nasdaq is down ‘just’ 12.5%.
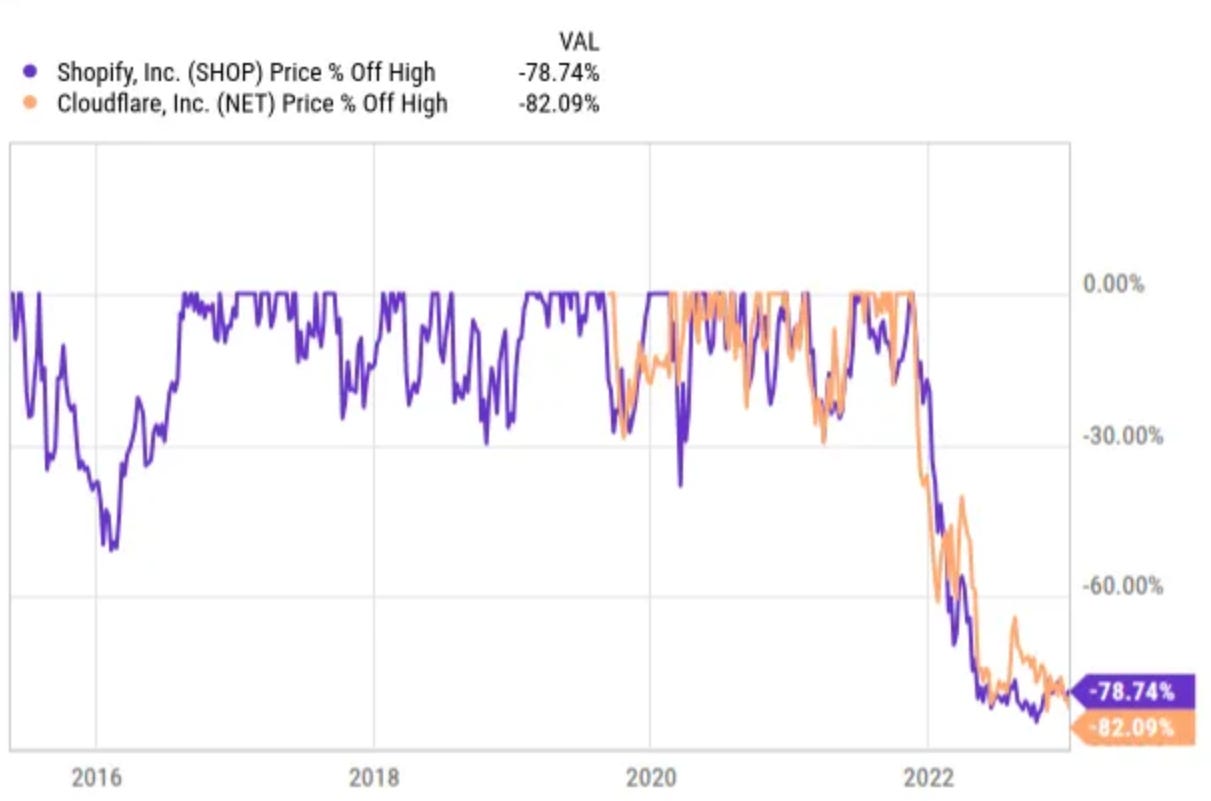
But the problem, both then and now, is that many stocks are down much more. Here are just two stocks from then, for example: Shopify and Cloudflare. Shopify was down more than 85% from top to bottom and Cloudflare 83%. This chart doesn’t show you the exact numbers because the stocks bottomed at a different moment, but it gives you a feeling of what it was.
You see the same thing now. While the index isn't down much, some stocks are down a lot. There’s negative market sentiment for all that are down and some have real or perceived company-specific issues.
It’s always possible that some never recover. That’s inherent to investing. You can never have only winners. The only thing we can do is keep monitoring our holdings closely, look at the fundamentals (not the price) and have patience.
I promise I will do my utmost best to help you to bridge this period.
Maybe this stat can help you. This is a midterm year and many midterm years have negative returns but all the consecutive years have positive returns since 1950, with an average return of almost 40%.

Of course, this is not a guarantee. Every situation is different and correlation is not causation. But don’t forget that the short-term market movements are emotional. But what will be the impact of the Iran war? We don’t know. We can only keep investing. Time in the market will always beat timing the market.
What we see now is a multiple contraction. The market dropped from a forward PE of 23.1 to 19 times in just a few times.

And do you want more reassurance? I saw this post.
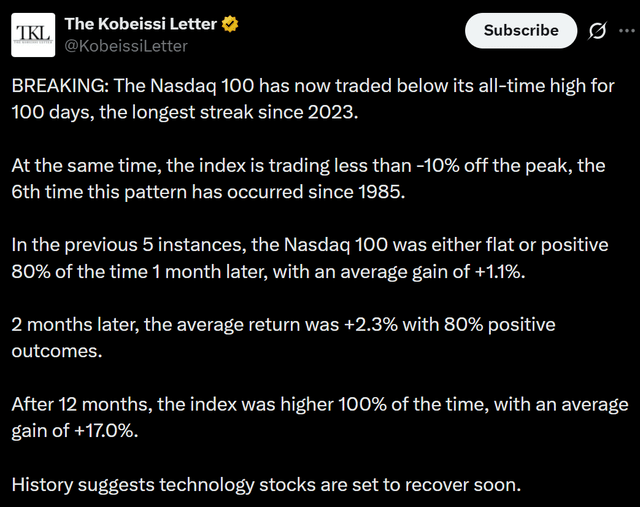

Again, be careful with these kinds of predictions. The markets are unpredictable. But overall, I think the sentiment is too negative now.
And you can see that from this as well. Nomura released a chart this week and I think it’s interesting.

It shows S&P 500 implied skew versus realized skew. In plain English, the red line is how much people are paying for downside protection (puts versus calls). The grey line is how much the market has actually moved down.
Look at the right side of the chart. The red line is spiking to high levels, even though I also want to point out that the period is short. But it shows that investors want protection against a crash. Many seem to expect the worst.
But if so many are already hedged, it actually protects the index from a big drop. After all, you won’t sell if you are hedged. I’m not saying we can’t go lower. We absolutely can. Duh! But it seems like a lot is already priced in. Maybe not in the index but in the hedges.
Also, don’t forget that the stock market just pulls back every now and then. Ben Carlson made this chart with an overview since 1928.

I also laughed with his description of what a bear market is:
Something that only lasts for like a month and happens every 3-5 years
So, don’t overreact. Just stay invested. Just look at this post.
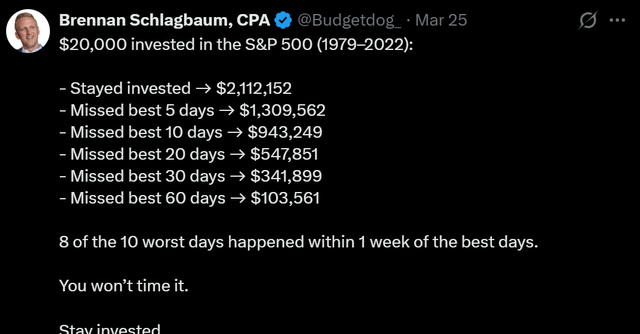
I always see people who say that if you miss the worst days, the result is similar. Of course it is, but you won’t time the worst days well without missing the best days. In that context, this sentence is crucial:
8 of the 10 worst days happened within 1 week of the best days.
Ok, one more, to close this off. This chart.

So, except for the mid-70s, the bottom was always very close when the stock market dropped 10 of the last 11 trading weeks. Again, correlation and causation are not the same, but maybe we are closer to the bottom than we might realize. Judging on the sentiment I hear from investors, which is very gloomy, that might be the case.
But the best thing of all is that you don’t have to predict this right. Just stay calm, keep investing and that alone will make you stand out.
And drink coffee or tea, if you like that. :-)
Articles In The Past Weeks
This is the fourth article this week.
In the first article, we analyzed TransMedics’ results and whether the stock is a buy now.
The second article showed that AI is a benefit, not a headwind, for CrowdStrike.
In the third article, I showed you which stocks I bought for my PM Future Fund portfolio.
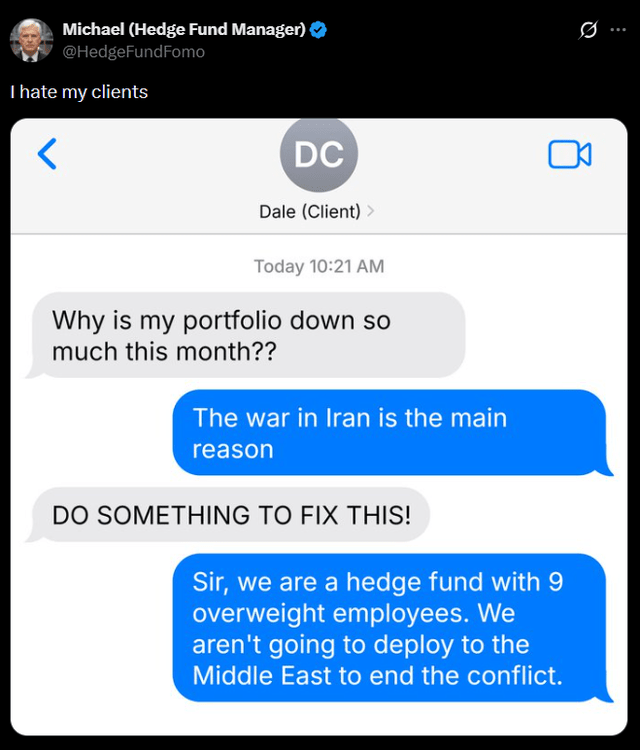
Memes Of The Week
It was a bit calmer on the meme front this week, with just two memes I liked enough to include here.
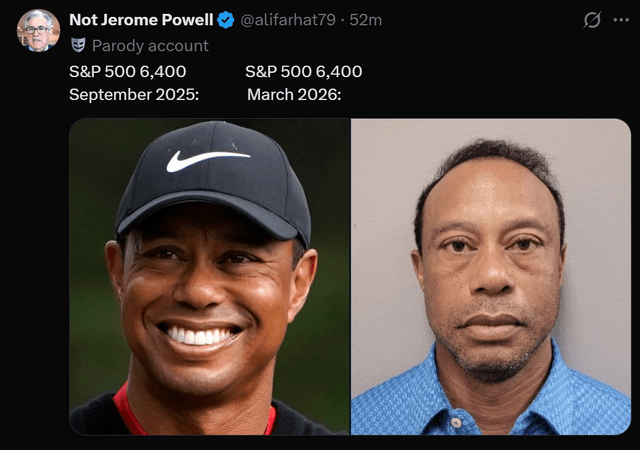
The second one tells you something about perception. The S&P 500 is now at the same level as in September 2025, but it feels totally different.
Interesting Podcasts Or Books
I didn’t find the time to listen to an investing podcast or start a new book this week.
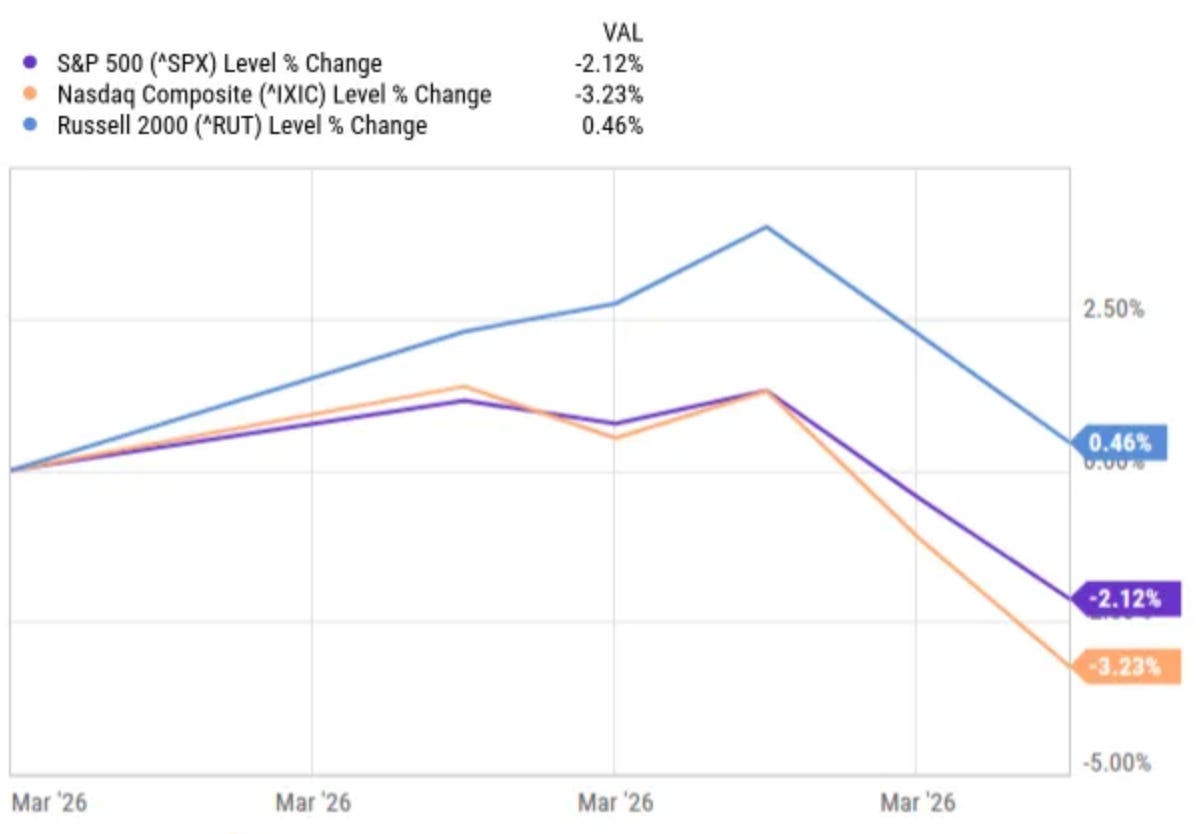
The markets in the past week
I don’t think I have to tell you that most stocks were down, but surprisingly enough, the Russell 2000 was up 0.46%. The S&P 500 was down 2.12% and the Nasdaq 3.23% this week. That’s quite a lot for indexes.
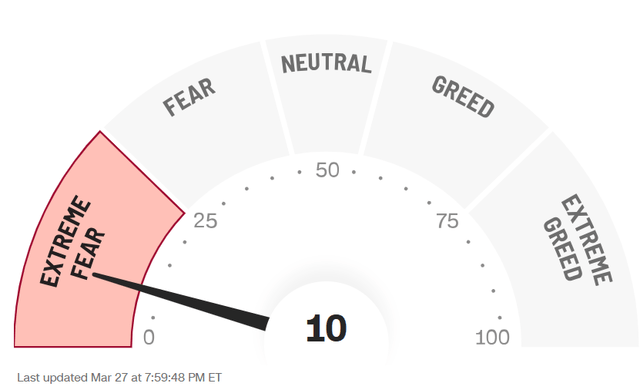
You won’t be surprised that the Greed & Fear Index dropped further, to 10.
Quick Facts
1. AI is not killing engineering jobs
Look at this chart from Trueup, shared by Lenny Rachitsky this week.

67,665 open engineering jobs globally. That’s 78% up from the low of 37,982. The most open engineering roles in over three years.
But yeah, of course, software engineers will be replaced by AI, right?
What we’re seeing here is Jevons Paradox playing out in real time. When something becomes cheaper to produce, you don’t use less of it. You use more. Way more.
Think about what’s actually happening on the ground. Companies outside of tech are realizing they can now afford software projects they would never have given the green light two years ago. Marketing teams at big corporations are bringing in engineers to automate workflows. Life sciences and healthcare companies are hiring engineers to automate research pipelines. Small businesses are hiring their first engineer ever to build better digital experiences. I could go on, but you get the picture.
Projects like this were too expensive or too complicated before AI made software incrementally cheaper.
Jevons Paradox means that if something becomes cheaper, the demand increases exponentially.
That means there will be much more software than ever before. And the people who understand how to build, maintain, and fix it will be wanted, just like they have been for years.
AI agents still require a human who understands what to prompt, how to review when an agent hallucinates, how to maintain the system that was built and so on.
All the advice floating around telling young people not to go into engineering is, in my opinion, very wrong. It sounds smart gets you clicks but data says the opposite. AI is currently not killing engineering jobs, no matter what you hear.
Of course, you might be shown this graph.

In that context, the rise of job postings looks minimal But you can see that the huge peak was caused by Covid, not by AI. Many people were fired during Covid, and, of course, job openings peaked when things normalized again.
2. Recession? CFOs Don’t Think So
This week, I saw this chart from The Daily Shot.

It shows the CFO Survey, tracking optimism about the US economy versus optimism about their own company. And there’s something interesting going on.
CFO optimism about the broader economy, the black line is down a bit. That’s what you would expect, with tariffs, the situation with Iran and its consequences, and the overall sentiment.
But look at the blue line. CFOs rate the optimism about their own company still very high.
Don’t forget that CFOs are well-informed. They see the order books and the margins. So, the difference in perception is interesting.
Now, this doesn’t mean everything is fine. CFOs can be wrong too. They can’t look into the future without fail. Orders can be canceled. But right now, CFOs, who have some of the best data points out there, are still confident about their own companies.
To me, that information is more valuable than a thousand doom-and-gloom X posts.
3. The US Market Concentration In Context
There’s been a lot of drama around market concentration in the US. The Mag 7 are too big, the S&P 500 is too top-heavy, it’s dangerous, it’s a bubble, etc. You’ve probably heard it all.
For context, look at his chart from Bloomberg Intelligence this week.

It shows countries ranked by the percentage of the market in the 10 biggest stocks. The US has only around 30%, one of the lowest concentrations. Some go to 80%.
Some concentration is completely normal. Great companies tend to keep growing. If you do well, it’s normal that your market cap keeps growing.
One of the things I see constantly in investing is people overcomplicating things. No, a slightly higher concentration in the top 10 stocks in the US doesn’t mean there’s a bubble or anything else. There’s too much noise out there.
4. Software Is Not Dead, Part 347
I know I have repeated this message in several forms multiple times already. But if I feel that everyone else says it differently, I think it’s good to keep repeating this to have a counterbalance to the noise.
Thoma Bravo just released their LP meeting slides. For those who don’t know, Thoma Bravo is the world’s largest software-focused private equity firm.
And what are they seeing? Fundamentals have improved while valuations have compressed. Look at this chart.

The Rule of Profile (free cash flow margin plus 2x revenue growth) has been trending up since mid-2024, hitting around 34-35%. At the same time, EV/FCF multiples have dropped like a rock because “AI will kill all software.”
Thoma Bravo’s view is simple and aligns with mine: all software companies are created equal. Business durability matters more than sentiment and sentiment creates opportunity.
Thomas Bravo has more data, more due diligence, and more skin in the game than any influencer tweeting about how AI will replace all SaaS. Or even multiple times more than hedge funds trading on this theme.
The market is not distinguishing between software that will be disrupted and software that will adapt and thrive. It’s selling everything. That’s how you get opportunities.
Do you want to continue reading?
Do you want to focus on the fundamentals of growth stocks?
Take a subscription to Potential Multibaggers.
Go to this page.
Subscribe to the annual plan.