
Overview Of The Week 6: AI's Productivity In A Chart
And why ex-US markets are more expensive than they seem to be

The week is already in the rearview mirror again and that means another Overview Of The Week.
Articles in the past weeks
This week was one of diving deep into the TransMedics short report. I like short reports because they can show weaknesses and risks, but 342 pages are just too much. I got through the report, but the article is not finished yet.
I want to address it adequately, which means I also need quite some text. Unlike the author of the short report, Scorpion Capital, I want to be nuanced in my take.
This week, you got the Best Buys Now for January, the first for 2025.
Memes Of The Week
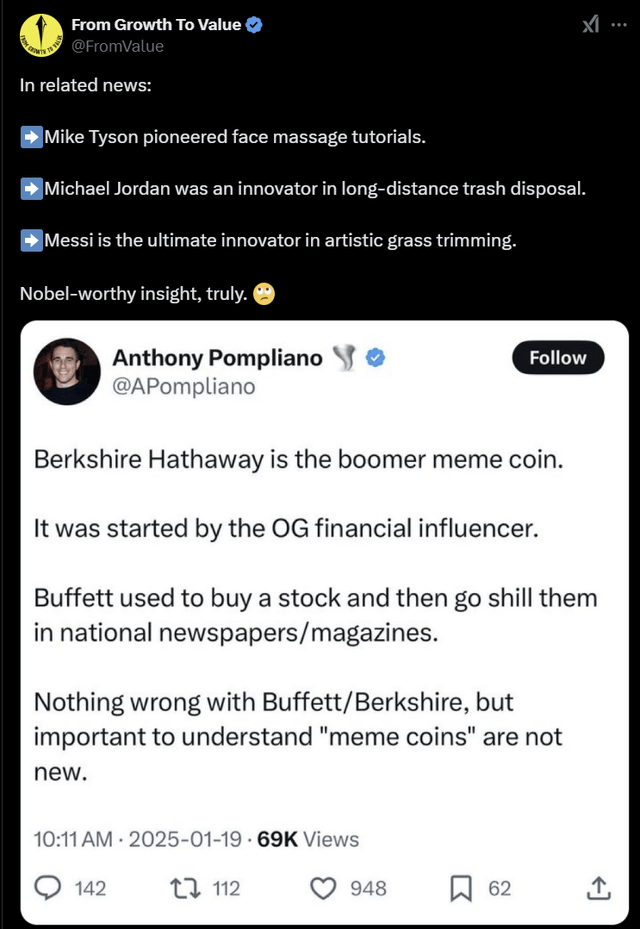
The first one was not a meme but a serious X post.

This guy has 1.6 million followers. My thought about this:
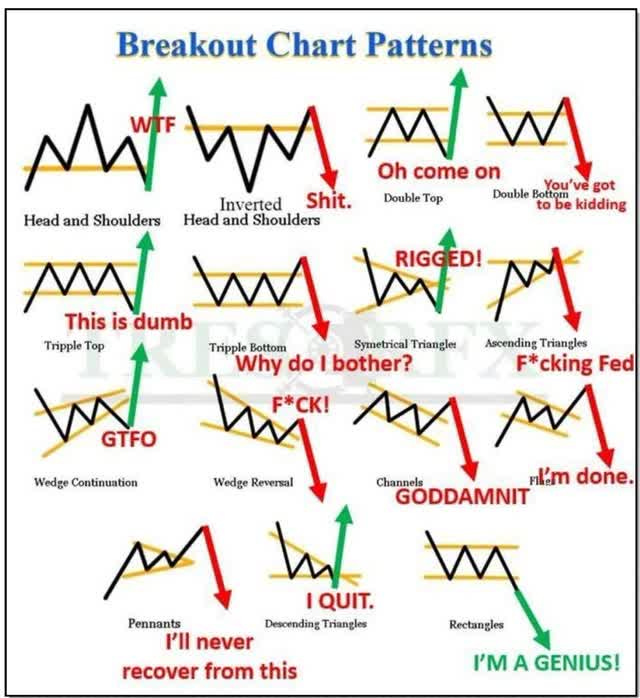
This is one that Karan shared in our stonk memes channel on Slack.
The 2025 stock market:

And Karan was on a role, posting this one too:
Interesting Podcasts Or Books
This week, I listened to The Intrinsic Value podcast episode about Coupang.

The markets in the past weeks

All indexes were up this week. The Nasdaq gained 2.45%, the S&P 500 2.91%, and the Russell 2000 was the week's winner, with 3.96%.
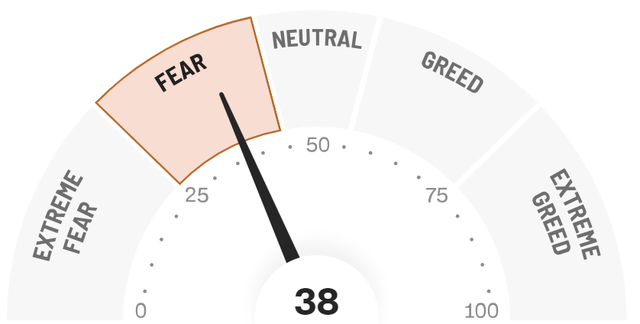
Despite the big gains, the Greed & Fear Index remained in Fear.
Quick Facts
1. SaaS Valuations
This week, I saw this chart of the valuations of SaaS companies.

As you can see, there's one extreme outsider, Palantir. I have already said multiple times that I like the company, but I don't want the stock at this price. Duolingo still looks good from this point of view. Cloudflare, Shopify, and CrowdStrike look a bit expensive, as also visible in my QPI scores.
2. AI not productive?
You continuously hear the argument from AI bears: AI is not profitable. "Show me the money."
Well, here it is:

As you can see, there's more and more revenue per worker and for the first time since the Great Financial Crisis, we have actually passed the previous top.
3. The US Expensive, The Rest Cheap?
Goldman Sachs did an interesting exercise. Suppose all other areas to invest in had the same sector allocation as the S&P 500? You can see the result here.
As you can see, everything gets more expensive on a price/forward earnings ratio. The Eurozone's forward PE jumps from 13 to 16, that of Japan from 14 to 17, emerging markets from 12 to 15, the UK from 11 to 16 and China from 10 to 15. Do you remember the chart I shared last week?

Add more growth in the US because of faster innovation and I don't think the US market is not as expensive as it seems compared to other markets.
You can read much more if you upgrade to a premium subscription.