

Hi Multis
I hope you had a better week than I did. I was sick this week. I'm still not back at full force, but since Friday, I'm good enough to write again and I enjoy it even more now that I couldn't do it for a few days.
That also means I start this Overview Of The Week with even more drive and gusto than other weeks.
Let's go!
Articles in the past weeks
Due to the circumstances, this is 'just' the third article this week. ('Just' because most stock services see that as a productive week).
On Friday, I worked on the question I got the most in the last week: a valuation update for The Trade Desk.
Yesterday, I also updated the Quality Score and valuation for Global-e and the Cloudflare valuation.
Memes Of The Week
Just one meme this week, about Tesla.
Interesting Podcasts Or Books
This week, I didn't listen to any podcasts and I was often too tired to read. So, hopefully more next week.
The markets in the past weeks
While we ended the week on a green day, the indexes still dropped substantially this week, with the Russell 2000 (which lost the most in the previous weeks) now losing the least, with 1.51%. The S&P 500 lost 2.27% and the Nasdaq dropped 2.43%.

So, where are we, put into a broader context? Right now, the S&P 500 is down 8.22% from its high, the Nasdaq 11.99% and the Russell 2000 16.30%.

But don't get fooled by these averages. Michael Batnick published this stat.

So, while the average of the S&P 500 is down just 8.22%, the median stock in the same index is down 18%. This shows the difference between average and median, but it also explains why many people feel much more pain than what the average would suggest.
The Greed & Fear Index remained in extreme fear, of course.

Quick Facts
1. Five Years Ago Today
Today 5 years ago, this is what we saw. In March 2020, it was clear that the coronavirus would not stay in China and that there would also be a lockdown in the rest of the world.

If you sold your stocks five years ago, this is what you have missed.

Of course, many individual stocks surged much more.
This is the Mag7 over that period.
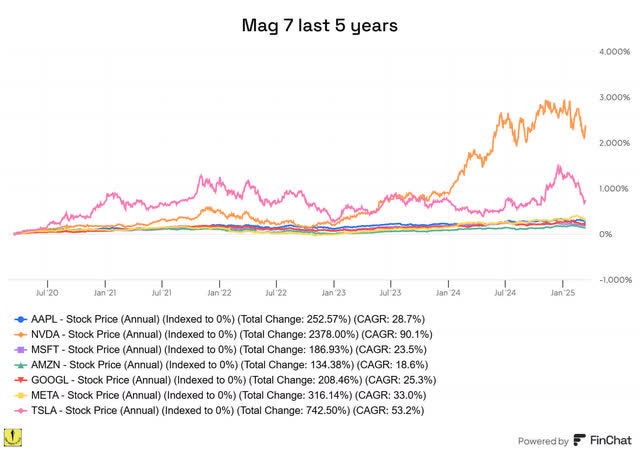
That's an average of 603%. That also means if you had invested $1,000 in each one, you would have had $42,191. Isn't the stock market a magical thing?
2. Howard Marks On Traders
This is a classic, but that doesn't mean everyone has already seen this. That's why I wanted to put it here for you.

Long-term investing can be hard and trading can sound tempting, especially because many chest-pounding, testosterone-fueled bragger-traders only share their winners and never show their losers.
But the biggest money, especially for individual investors, is in holding stocks for the long time.
3. Fundamentals Matter... A LOT
In that context, it's good to zoom out. Over the short-term, the market can feel like a gambling place, but it's not over the longer term.
Amazon's chart is a great example. This is the last 20 years. The CAGR (Compound Annual Growth Rate) over that period of revenue is 25.5%. The CAGR of the stock price? 25.8%

I have used this often before, but revenue is by far the biggest stock price return driver.

PS: If you want to use Finchat as well, with my discount, it’s just $289 per year (!) for top-notch charts, AI, earnings calls, estimates, insider holdings, etc, etc, etc.
4. Truflation
It's been a while ago, but now that macro comes into the picture more, I wanted to revisit Truflation. For newer Multis, fist a short explanation. The official inflation numbers we get have a lag. Especially housing prices have a lag of 6 to 9 months.
Truflation claims that it can measure inflation in real time. I've followed it for years, and overall, it does quite a good job.
So, how does it look right now?

In the last week, it jumped, but overall, what Truflation claims to be live insight into inflation is still low at 1.68%.