

Hi Multis
It was a bloody Halloween on the stock market. More about that later in this Overview Of The Week, of course.
The Overview Of The Week is stable. Sun or rain, green or red, greed or fear, on Sunday, you get your weekly dose of stock market context.
Let’s go!

Articles In The Past Week
Just like in the last few weeks, you got four articles this week, including this one. To make sure you don’t lose track, here are the three previous ones.
The first article this week was on my personal portfolio, the Forever Portfolio. I sold two positions and added to 7.
Sea Ltd has gone down a lot lately. In the second article this week, I assessed the earnings and the reasons for the sell.
You also got the second Adyen article in two weeks. The company gave a business update and the stock dropped 13%. In my article, I separated facts and sentiment.
Memes Of The Week
Multi Flo, our Meme King, posted this.

Interesting Podcasts Or Books
This week, I read the book How Great Ideas Happen by George Newman.
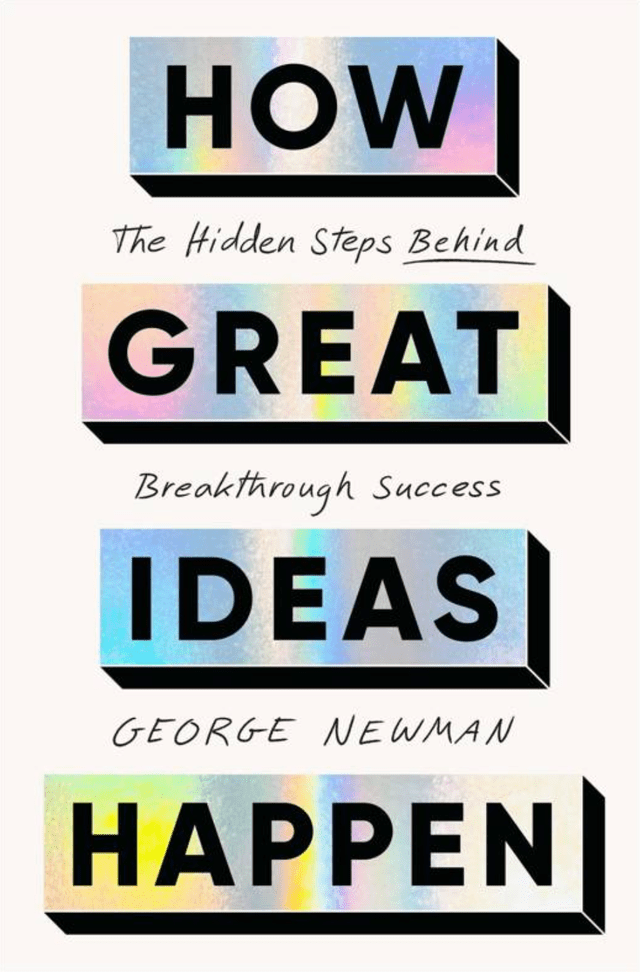
It's a good book for anyone whose job involves some creativity. Don't take this too literally. It's about ideas, so, many jobs or even your personal life can benefit from the book. It has interesting insights on why originality matters, how being too creative can be a disadvantage, how to generate better ideas, why the quantity of ideas is more important than you might think, and more.
It’s an easy read but I still learned a few things.
The markets in the past week
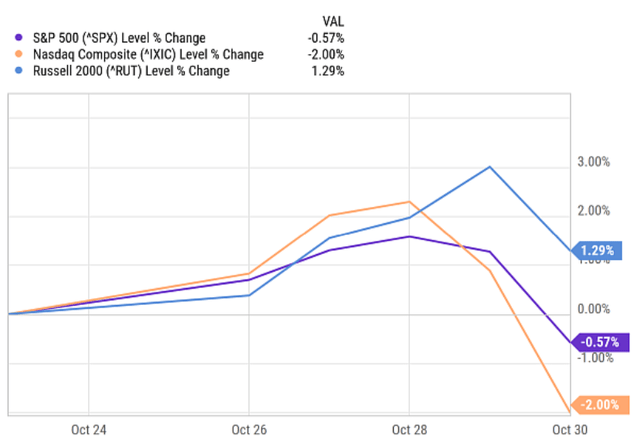
Sometimes, you have these weeks, weeks in which you don’t have to wonder what the stock market did because you already know. This was such a week.
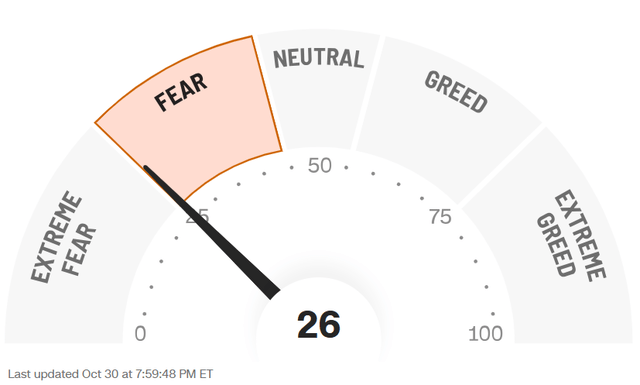
The Greed & Fear Index was in EXTREME FEAR last week, but it inched up a little bit and it’s now in FEAR, but still very close to EXTREME FEAR.
Quick Facts
1. The Bloody Halloween Day
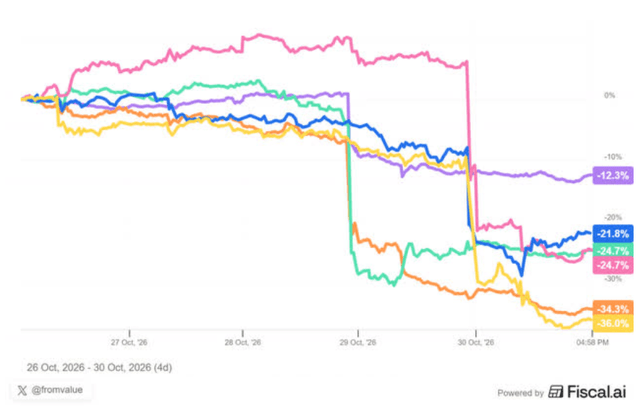
On Thursday, but even more on Friday, some AI-related stocks dropped on their earnings results. Here are some examples.
If you want a 15% discount for Fiscal, you can get it through this link.
But just like Halloween monsters, these drops may scare you, but only as far as you allow.
What I mean is this. You all know that the Halloween monsters, ghosts, severed heads (or hands, looking at you, Heidi Klum), zombies and other creatures are not real. And as adults, they mostly don’t scare us because of that knowledge.

(Heidi Klum in costume, source)
In the same way, these big drops can only scare you if you believe they are real. Now, I know this is quite a jump. You may have seen money disappear from your broker account and that money is definitely real. The same goes for your fear if you allow it.
The market goes up and down. It goes up more often than it goes down, but when it goes down, it can feel horrifying. It’s important to keep your goals in mind in such periods. For many, including myself, the goal is more than ten years out. You just know that the markets will go up and down over such a period.
Now, don’t get me wrong. I don’t want to brush this off. Many stocks are down, even when the indexes are still up. I have already written twice about the bear market beneath the surface.
The equal-weight S&P 500, which lets every stock in the S&P 500 account for the same amount (about 0.2%) beat the regular, market cap-weighted S&P 500 by 5.85 percentage points in October.
That’s the biggest outperformance for the equal-weight S&P 500 since April 2009 and the second best since 1990. In September it was the other way around: the cap-weighted index won by 4.61 points. That means a swing of 10.46 percentage points in one month, the largest in either direction since at least 1990. That’s what you are feeling.
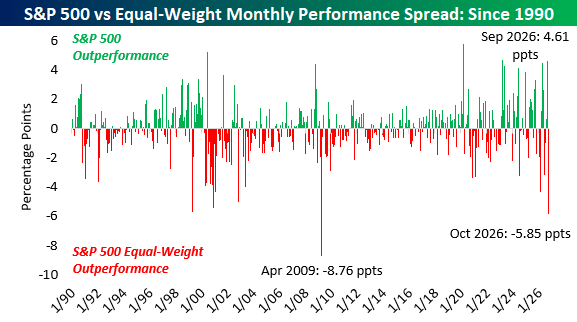
Before this month, there were only four months where equal-weight won by 5 points or more: April 1999, December 2000, November 2002 and April 2009. In April 1999, the market continued up for a while, in December 2000, there was a bear market already and the two others were shortly after the bottoms of the bear markets. But the most frightening thing was that none was far from a bear market.
There’s also this chart.
This chart
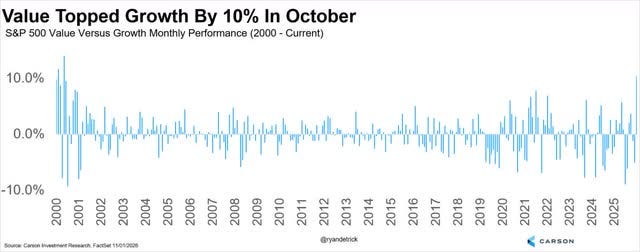
Now, don’t get me wrong. I don’t predict an impending market crash. Timing the market is very, very, very hard. But it sure feels like the bull market is losing some of its steam.
On the other hand, healthy bull markets need to let off some steam every now and then. And there’s also this chart, which shows we go in the statistically best period of the year.
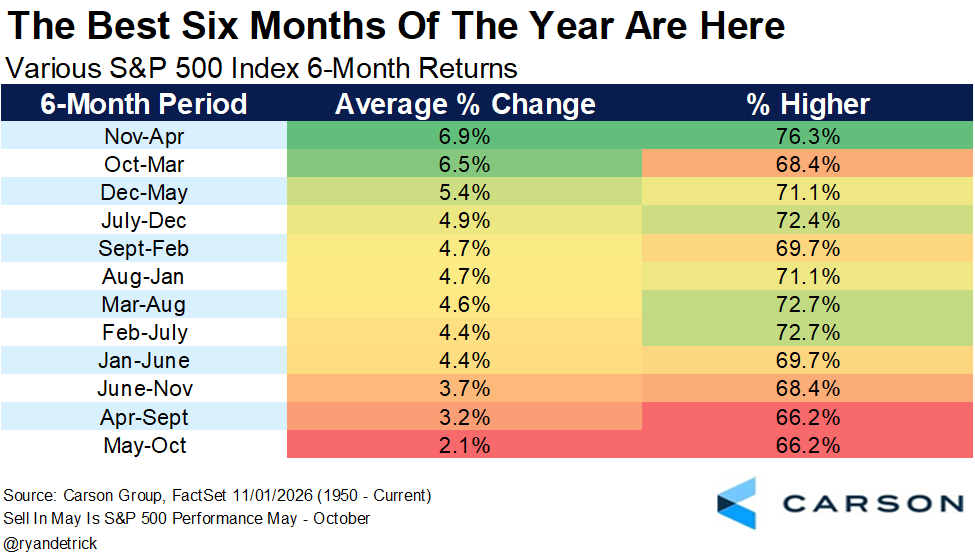
You could argue, with good reasons, that the differences are not that big. But if you look at years with midterm elections, that’s different.
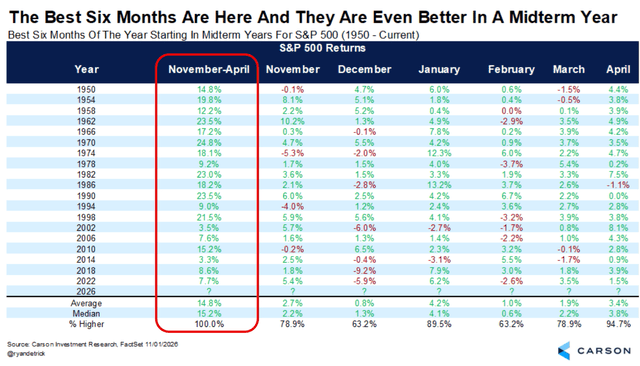
Since 1950, so 76 years ago, every midterm single November-April period after midterms has been positive, with an average of 14.8% and a median of 15.2%. That’s remarkable. But it’s not a guarantee, of course.
As always, we will have to wait to see what the market brings. Having some cash ready is always good in such periods, but on the other hand, don’t forget this Peter Lynch wisdom.

So yes, it was a scary week. But fear is exactly when you need to know what you own and why. That’s what the rest of this Overview is for.
Don’t want to go into the upcoming week unprepared?