

Hi Multis
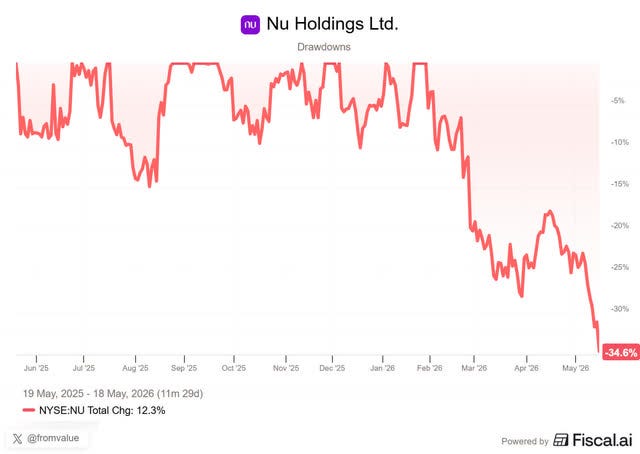
Last Wednesday after the close, Nu Holdings (NU) reported its Q1 2026 results. The stock dropped more than 6% the next day but it had already dropped before and that means it’s now down 35% since its high in January of this year, just a few months ago.
Within minutes, the bear narrative was circling on X: provisions are surging, NIMs (Net interest margins) are compressing, asset quality is deteriorating, and the growth model hit its limits. Wow, that was fast! But was it correct?
If you are a shareholder, no matter how well you know the company, this will always sound convincing to some extent, even if it’s pure noise. But what is signal and what is noise? The company should help us, shareholders, to make that distinction and fortunately, Nu Holdings is generous in that regard.
This was one of the most informative earnings releases I’ve seen in a long time. Management analyzed almost every line item that the bears pointed out. I want to thank Nu’s management for making my job a ton easier.
It’s funny to see how two Latin American companies (NU & MELI) beat a large majority of American companies in providing detailed information to their shareholders.
Let me walk through what the market hated, what the data actually shows, and then everything else that matters for the next ten years of this company.

The Numbers
Let’s first look at the numbers. (FXN= FX-neutral, the business growth without currency impact.)
Revenue: $5.32B, +53% YoY, beating the consensus of $5.06B by $260M.
EPS (GAAP): $0.18, missing consensus by $0.01.
Net income: $871M, +41% YoY FXN, down 5% QoQ from $895M.
Adjusted net income: $937M, beating the consensus of $928M.
Gross profit: $1.88B, +27% YoY FXN, down 7% QoQ, mostly because of elevated CLA (credit loss allowance), more on that later.
Gross profit margin: 43.8%, missed by 8.5 pp
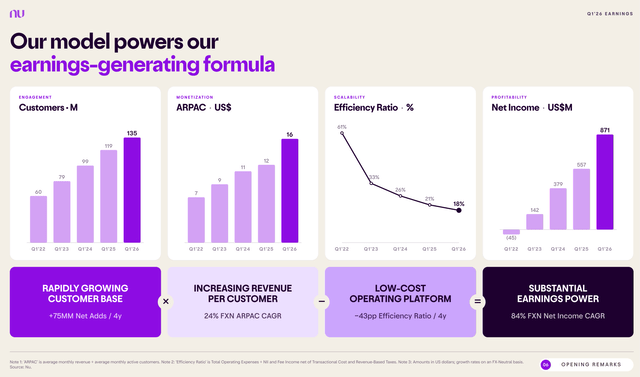
Customers: 135M, +14% YoY. 4 million net adds in the quarter.
ROE (return on equity): 29%. Adjusted 31%.
Total credit portfolio: $37.2B, +40% YoY FXN, +7% QoQ.
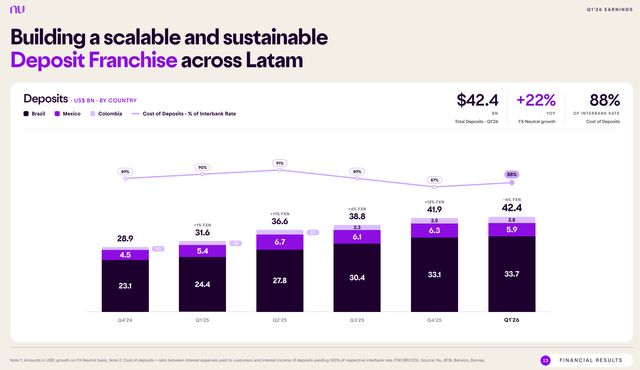
Deposits: $42.4B, +22% YoY FXN.
NIM: 21.1% (from 19.5% in Q4 2025).
Risk-Adjusted NIM (net interest margin): 9.5% (from 10.5% in Q4 2025).
First, a quick note on the EPS miss. Nu introduced a new P&L (profit & loss) framework in Q4 2025. Many have not yet used this new model. On top of that, the consensus is a mix of IFRS and adjusted numbers and you will sometimes even see a miss on revenue because of that confusion. So, I wouldn’t worry about the EPS “miss” too much. IR officer Guilherme Souto opened the call by pointing this out immediately:
We are aware that consensus estimates across the sell side reflect the mix of IFRS and managerial frameworks, and we encourage everyone to use the reconciliation report as a reference point for aligning models going forward.
I love it when a CFO points analysts to this directly. I think the estimates will be more accurate going forward.
What The Market Didn’t Like
Let’s start here, as I always try to understand the negativity to assess whether it’s warranted or not. I think three numbers and one extra element drove the (limited) selloff after the earnings and the bigger 35% drop since the all-time high.
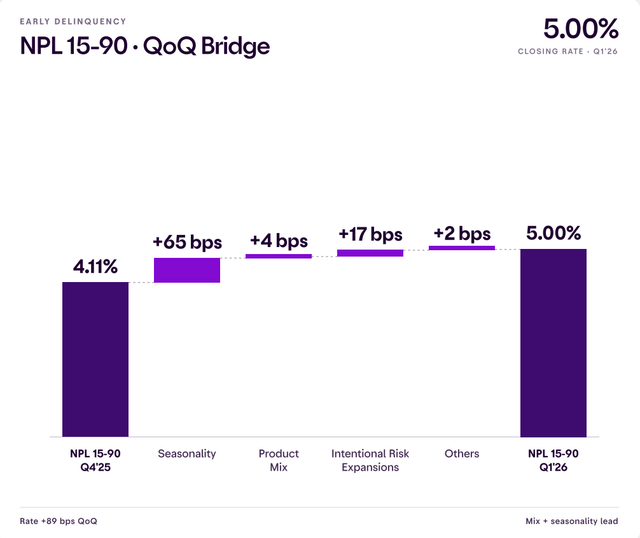
The first is the 15-90 day NPL (Non-Performing Loan) ratio, which jumped from 4.11% to 5.00% QoQ. An 89-basis-point move in just a quarter is the largest in over a year. Read in isolation, that’s an ugly headline.
The second is the CLA (Credit Loss Allowance, the money Nu sets aside on its balance sheet for expected losses on its credit book), which jumped to $1.79B, +33% QoQ. That doesn’t look great either, does it?
The third one is risk-adjusted NIM. NIM, or net interest margin, is what a bank earns on its lending after subtracting its funding costs. Risk-adjusted NIM goes one step further by subtracting credit losses. That makes it a better measure of the credit book’s actual profitability. It dropped from 10.5% in Q4 2025 to 9.5% in Q1 2026.
Some, obviously people who want to feel sophisticated, point out the macro economy in Brazil and point out that 44% of Brazilians defaulted on their credit, so the loan market should absolutely be avoided at all cost.
Out of those four factors, you can build any bear case you want and that’s what I see happening quite widely.
And probably, if you are a shareholder, at least one of them, probably multiple, or all of them sound convincing. But none of them mean what you think. That’s quite a statement, I know. But if you have read this article, please let me know if your worries have decreased or increased.
Let me walk through the first three factors one by one. The macro thing comes later.
The NPL Bridge
For the first time, as far as I know, Nu broke down the 89 bp NPL jump into its drivers.
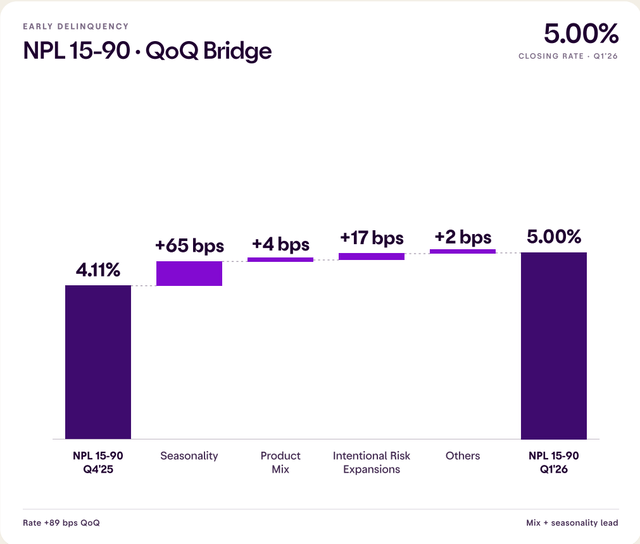
So, about two-thirds of the deterioration is simple seasonality. Every Q1 in Brazil looks like this. Just compare the last three Q1 numbers: 5.1% in 2024, 4.8% in 2025, 5.0% in 2026. You see the same pattern every year.
The 90+ NPL ratio, which is what turns into write-offs and losses, came down slowly from 6.6% in Q4 2025 to 6.5% in Q1 2026. That’s well below the 7.0% peak from Q3 2024.
So the headline that scared everyone is doing what it always does in Q1. But this time, because of the headline consensus misses (which came from quite some analysts using an old model in their estimates). That’s why the NPLs were singled out more, ignoring the seasonality.
CFO Guilherme Marques do Lago put it well. But before I quote him, I want to explain what NPVs are. It stands for Net Present Value, the value of all future profits from the loan book after costs.
The goal of our credit operations, it’s not to minimize NPLs at a point in time. Instead, it is to optimize for resilient NPVs. NPLs only capture the cost side of the equation. They say nothing about the revenues we generated from the customers who perform.
This matters and it’s also how I think. Banks that obsess over keeping NPLs low only lend to the safest customers, at the lowest spreads, with mediocre returns as a result. Nu price risk into the spread and accept that some customers won’t pay, and that makes it grow into much wider customer bases at much higher returns. The first is the incumbent model. Nu does the second.
The CLA Surge
The same logic can be applied to provisions. Just as a reminder. Credit Loss Allowance is the money on the balance sheet for expected losses on the credit book. It went from $5.30B at the end of 2025 to $6.10B at the end of Q1, an $800M increase. Management gave us the explanation again.
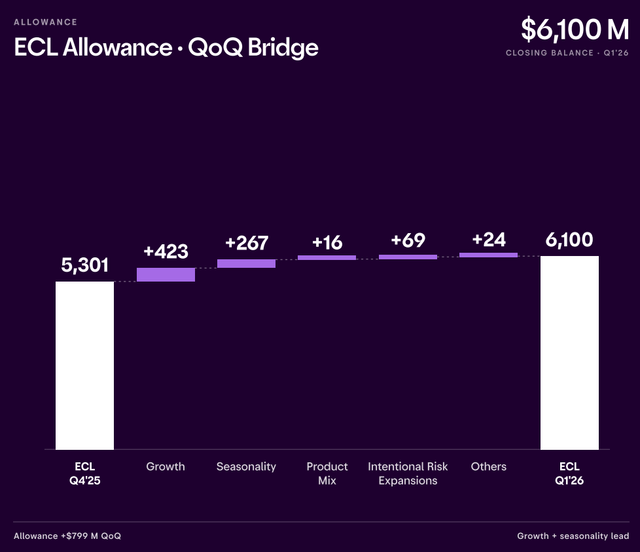
Growth and seasonality together explain $690M of the $800M, or 86%. Credit quality contributed almost nothing.
There’s an accounting rule that I also mentioned in the context of Mercado Libre. When a bank originates a new loan, it has to set aside the entire expected lifetime loss on that loan immediately, before earning a single dollar of interest. So if you’re growing fast, you front-load losses into today’s earnings while the offsetting interest income shows up over the coming quarters. That makes things look much worse than they actually are. That’s the ‘growth’ component, by far the biggest contributor.
Nu’s total exposure grew 44% YoY FXN to $70.7B. Total exposure is the credit card limits Nu has given its customers plus the money actually borrowed, so it’s much bigger than the drawn credit portfolio. Every dollar of that exposure gets a provisioning charge upfront, whether the customer ever uses the limit or not.
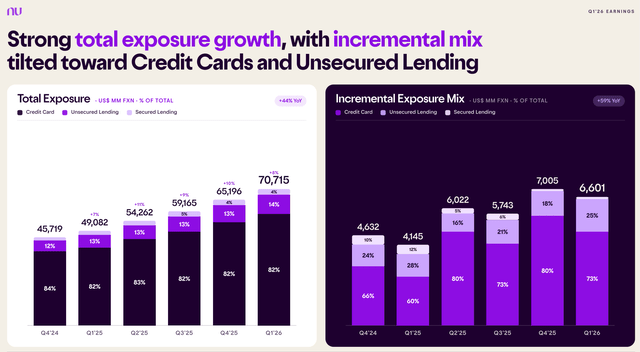
Look at the mix on the right side. In Q1’26, credit cards were 73% of the new exposure, and unsecured lending was 25%. That’s 98% combined. A year ago, credit cards were 60% and unsecured 28%, or 88% combined. Secured lending declined from 12% to just 2% over the last year, due to regulatory changes to the FGTS product at the end of 2025. FGTS (Fundo de Garantia do Tempo de Serviço) is a Brazilian employment-savings fund used to secure consumer loans.
Cards and unsecured loans have a higher expected loss than secured loans. They also yield much more, but the provision rises as more credit cards and unsecured loans are issued.
In short, the same dollar in loans now has a higher yield but also higher provisions than six months ago. That’s not because customers are of lower quality but because the yield is higher.
The NIM Drop
Now the risk-adjusted NIM. Yes, 9.5% is lower than 10.5%. But the overall NIM moved the other way. NIM, that’s before credit losses, went from 19.5% in Q4 to 21.1% in Q1, up 160 bps. As the risk-adjusted NIM went -100 bps, as we just saw, that means that the gap widened by 260 bps in one quarter. That sounds ugly, right?
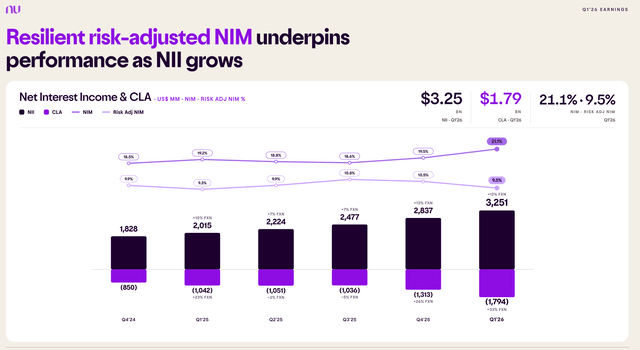
But it’s simple. That gap is the same accounting requirement at work. The yield on the new originations shows up in NIM but the expected losses on those same originations show up in CLA (Credit Loss Allowance) right away. This is a way you can look at: the real losses will arrive over the coming quarters, but they are already in the books. At the same time, interest income continues coming in every quarter. By Q3-Q4 of this year, the two lines should meet back up. CFO Guilherme Marques do Lago:
We expect risk-adjusted NIM to move back towards the level we operated at during the second half of 2025 as the dynamics of first quarter normalize over the coming quarters.
So the compression is probably just a quarter of seasonality, not a structural break.
The Cohort Economics
Even if seasonality explains the Q1 rise, the loss rates Nu shows for some cohorts appear high in absolute terms. 22% in losses on unsecured lending and a whopping 33% in losses on Mexican credit cards. Aren’t those scary numbers?
Here, Nu’s most interesting new disclosure comes in. They gave us the full unit economics of the three biggest unsecured franchises, with every component broken out.
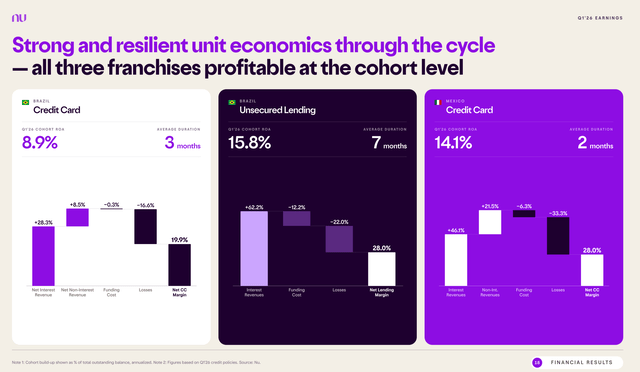
Brazil unsecured lending: 62.2% in interest revenues, -12.2% in funding costs, -22% in losses = 28% net lending margin. That leads to a cohort ROA (Return on Assets) of 15.8% for a loan book with a 7-month duration. Do you already see what is happening here?
Brazil credit card: 28.3% net interest revenue + 8.5% non-interest revenue, -0.3% funding, -16.6% losses = 19.9% net margin. Cohort ROA of 8.9% on a 3-month duration.
Mexico credit card: 46.1% interest revenue + 21.5% non-interest revenue, -6.3% funding, -33.3% losses = 28% net margin. Cohort ROA of 14.1% on a 2-month duration.
For context: global bank credit card portfolios typically earn ROAs of 3-5%. Of course, that’s a different context. The best Brazilian incumbents earn 8-14% on cards, with much lower loss rates because they only lend to the top tier of customers. Nu is in a completely different league, and three things make that possible:
Brazil’s policy rate (the Selic) is at 14.5%, which means lending spreads are structurally enormous.
Nu’s cost to serve is $1.00 per active customer per month, an order of magnitude below that of the incumbent banks.
A short-duration credit book that lets management react fast when something changes.
Just look at those durations again. Brazil credit card: 3 months. Brazil unsecured: 7 months. Mexico credit card: 2 months. Traditional Latin American banks operate with durations measured in years. Mortgage-heavy banks are in the high single digits in duration.
CFO Guilherme Marques:
We are not a loan book lender waiting quarters and quarters to see the impact of a credit policy change. We see it in days, and we act on it immediately.
Nu uses duration as a risk-management instrument. That’s why they can underwrite cohorts with high loss rates and still earn returns that don’t exist anywhere else in banking. You saw that in the numbers. In other words, that’s not risk-taking, it’s pricing risk at the correct premium.
Float
The credit story took all the attention this quarter, but something else caught my eye.
Look at this graph.
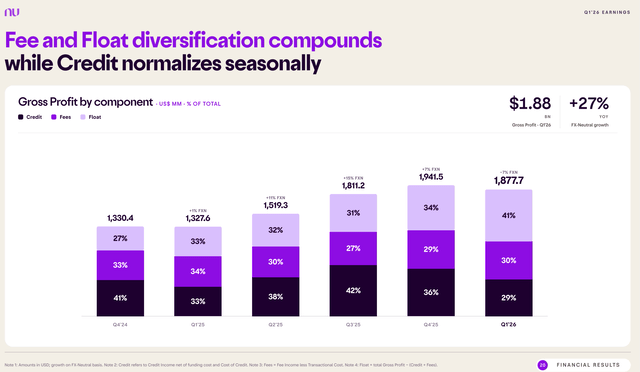
As you can see, float made up 41%. Float is the interest Nu earns on customer deposits that aren’t lent out as loans. With $42.4B in deposits and only $22.8B in net credit portfolio, that’s a loan-to-deposit ratio of 53.8%. So, for every $1 of deposits Nu has, only about 54 cents is currently lent out. Or put differently: Nu has a big pile of unloaned deposits sitting on the balance sheet, earning the local risk-free rate. Deposits compound faster than loans, which means that float income grows with them.
In Q1, the contribution of credit also dropped because CLA was higher, as we saw earlier. That part is seasonal and will largely reverse in the rest of the year. If you take a step back, you see that gross profit is becoming more diversified across credit, fees, and float. And that’s a good thing. It’s making Nu stronger.
This is the final proof. If you thought that Nu was a one-trick credit card pony, this quarter shows you are wrong. Fees and float together now make up two-thirds of gross profit.
Two Tailwinds In Brazil
In the Q&A, CFO Guilherme Marques do Lago mentioned two structural Brazilian tailwinds.
The first is the new Brazilian income tax exemption for monthly earnings up to BRL 5,000 (about $1,000). There are even partial reductions up to BRL 7,400 (about $1,500). That means that most ordinary people with a job will profit and those people are exactly More income means more loaning capacity and lower expected loss rates on the cohorts already on the book.
The second is about what I mentioned as a part of the bear case: macro. Yes, credit default numbers in Brazil are simply insane if you are used to the West. That 44% default number is correct.
But the problem is that bears make it sound as if this came out of the blue and now it’s an incredible, unprecedented time in Brazil, which is simply not the case. The default rate has been around 40% for a very long time already and yes, it went up slightly. Well, slightly, from give or take 40% to 44% is still a lot, as it’s up 10% but it’s not as if this is a new situation in Brazil. Don’t forget that this is the environment has operated in for years and it has thrived by pricing loans very correctly. We’ll see later in this article why they have even become better at this. Hint: AI.
On top of that, the government also knows this and it launched something they hope can help.
But back to the government initiative. Desenrola 2.0, the second round of a Brazilian federal debt renegotiation program. The first round (in 2023-2024) helped about 15 million Brazilians with defaulted debts renegotiate them at steep discounts, clear their names from the credit bureau blacklist, and rejoin the credit system.
Desenrola 2.0 is expected to launch in Q2 and Q3 2026 and should bring millions more newly bankable consumers into the system. Nu, as the dominant brand in Brazil, is well positioned to capture them as new customers. CFO Guilherme Marques do Lago called the program “either neutral or positive” for Nu.
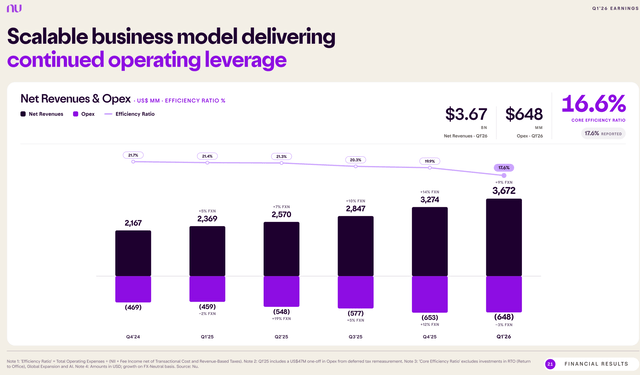
Efficiency
Now to the efficiency ratio. The efficiency ratio measures how much a bank spends in operating costs to earn one dollar of revenue. The lower, the better. You may know this from your favorite insurance company.
A traditional Brazilian incumbent typically runs at 40-50%, meaning they spend 40-50 cents to earn one dollar. Nu came in at 17.6% this quarter. That’s about 18 cents to earn one dollar, which is less than half of an incumbent. Pretty impressive.
But it’s even better. Nu makes investments in three things that other banks are not doing: bringing employees back to the office, expanding internationally (to the US), and building out its AI infrastructure. If you strip those out, the “core” efficiency ratio is 16.6%. With just $16.6, the company can earn $100. That’s great. A year ago, the efficiency ratio was 21.4%, so this is a big improvement. The operating leverage is doing its work.
NU CFO Guilherme Lago told us not to extrapolate, though:
The first quarter came in better than expected for 2 reasons working together.
Number one, revenues accelerated faster than we anticipated, driven by both ARPAC outperformance and continued portfolio growth.
Second, OpEx came in below plan...
Roughly 1/3 reflects structural efficiency gains that are durable and compounding, mainly AI-driven improvements in operations and collections, software platform consolidation and hiring discipline. Now the remaining 2/3 reflect timing items that will normalize in the next quarters.
He gave us the full-year guidance: roughly 20% efficiency for 2026, in line with where 2025 ended, but including all the strategic investments. The core efficiency ratio (the trend excluding those investments) continues to go down, which is great to see.
ARPAC & Cohorts: No Plateau In Sight
Monthly ARPAC (Average Revenue Per Active Customer, remember that, as I will use it multiple times) for Q1 2026 was $15.9, +23% YoY FXN, up from $15.0 in Q4.
That’s the average across all customers. Mature customers, those who’ve been with Nu for 96 months (8 years), generate $30.8 in monthly ARPAC, nearly double the company average. And it keeps going up year after year.
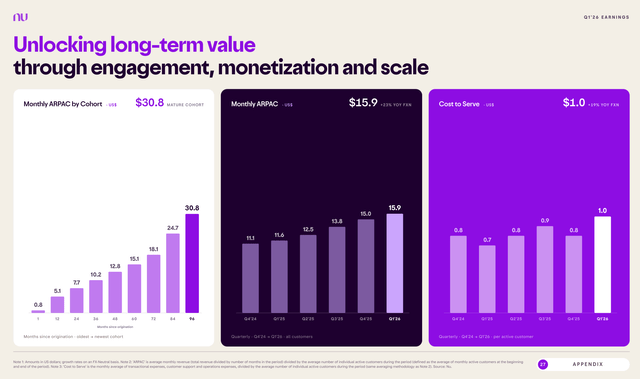
Look at the cohort progression. It looks linear and so far, there is no plateau in sight.
Now think of the customer base. Nu has added more than 65 million customers over the last three to four years.
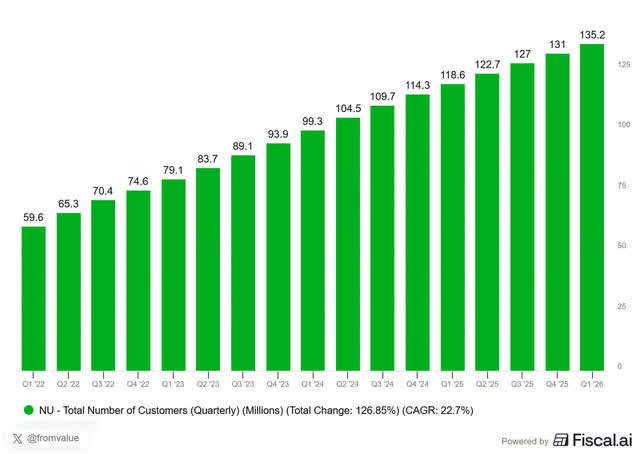
Just insane. But that entire cohort is still in the stage of the low ARPAC in the graph. If they do ever remotely do as well as the older cohorts, the revenue growth from existing customers alone will be huge. And that’s before Nu adds new customers, launches new products, or starts in another country.
Monthly costs to serve customers are around $1.00 per active customer. The ARPAC of $15.9 against $1.00 of cost, that’s phenomenal operational leverage.
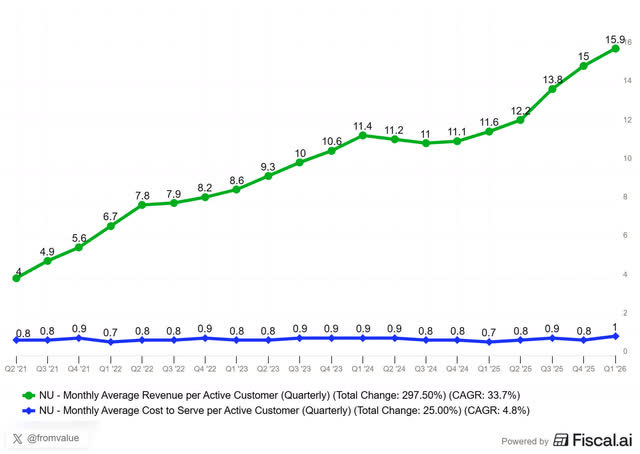
The cost to serve is up 19% YoY, which is faster than historically, but still extremely low. ARPAC is up 23%, so the gap is still broadening. I expect the cost to serve to increase if the company focuses more on small- and medium-sized businesses and the wealthier segment of the population. But of course, in that case, the ARPAC should also rise.
Mexico: The First Quarter Of Profitability
It was great to hear that Mexico has already seen its first profit in this quarter. And not on some adjusted or managerial measure, but on an IFRS basis (International Financial Reporting Standards, comparable to GAAP).
That was even faster than management had foreseen. CEO David Velez:
In Mexico, we have moved from a $30 million quarterly loss to our first quarter of IFRS profitability, a milestone that arrived ahead of our own internal plan.
And again, management gave us an interesting slide full of information.
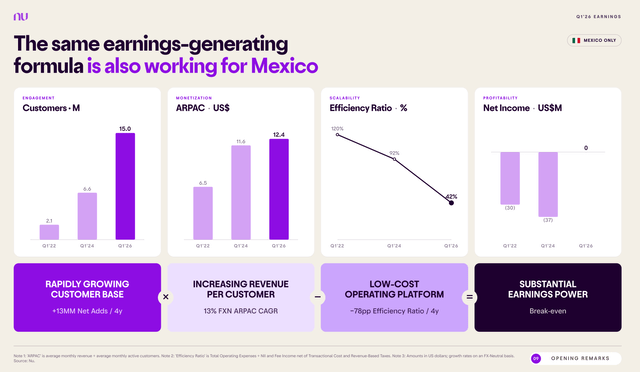
The number of customers rose from 2 million to 15 million over four years, while ARPAC nearly doubled from $6.5 to $12.4. The efficiency ratio dove from 120% to 42%. That’s incredibly strong and another testament to how well the company is doing. And as we already saw, the cohort ROA on credit cards in Mexico is 14.1% on a duration of just 2 months.
Mexico is no longer the experiment. Nu is already the third-largest financial institution in Mexico by customer base. The playbook that management applied in Brazil is working in Mexico.
The Mexican population is around 130 million, so there is still a lot of room to grow from the 15 million customers Nu has now. If Mexico grew to the same size as Brazil, you could expect more than 80 million customers. I’m not saying they will do that but that’s the potential. And management is not shy to show the opportunity.
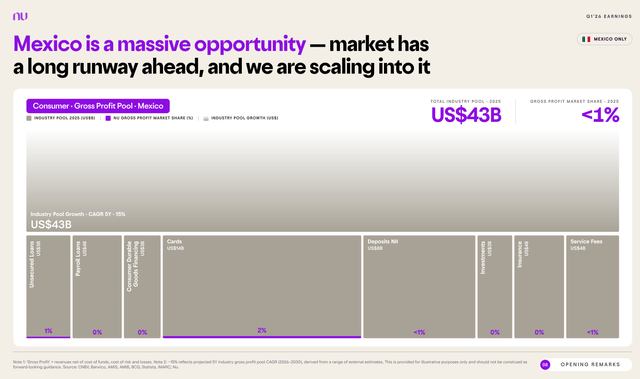
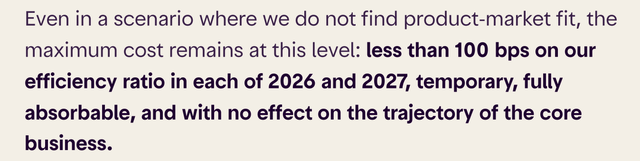
Nu’s gross profit market share in Mexico is below 1%, in a $43B annual pool that’s expected to grow by 15% per year. Compare that to Brazil, where Nu has a 7% share of a $100B pool growing at 8%. The Brazilian pool is bigger and Nu’s share is much bigger, but the Mexican pool is growing almost twice as fast and Nu’s share is tiny. Over the next decade, Mexico could very well compound faster in absolute terms than Brazil.
Colombia is the third country where Nu is scaling. The customer base is approaching 5 million now and the country is still in investment mode, just like Mexico was from 2020 to 2025. Nu is now intentionally operating at a loss there to build out the brand. It’s that same playbook again
The US Opportunity
In previous articles, I already mentioned multiple times that Nu received conditional approval from the OCC (the Office of the Comptroller of the Currency, the US national bank regulator) for a national bank charter in January. Management has confirmed the seriousness of the move but has not shared the go-to-market strategy or any other details so far. But co-founder Cristina Junqueira, Chief Growth Officer, has relocated to the US and is now the CEO of NU there.
Again, management wanted to be very clear about this expansion. For competitive reasons, it doesn’t want to share its approach, which I think is fair, but it was clear to shareholders what this would cost.
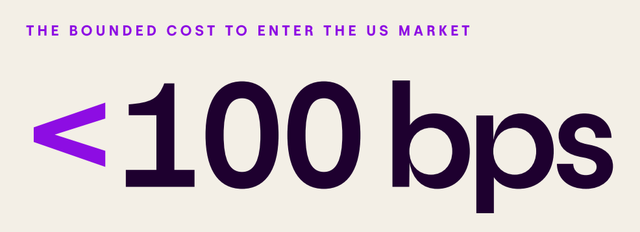

CEO David Velez:
To be precise, the maximum OpEx headwind we expect from US investment in each of 2026 and 2027 is less than 100 basis points on our consolidated efficiency ratio. And this is inside the 20% efficiency ratio level Lago mentioned before. For a company at our scale, that is quite affordable.
Beyond that, any additional investment is explicitly contingent on clear evidence of product market fit and a credible path to profitable scalability.
This is how companies should take bets. The downside is capped and restricted in time. The upside is asymmetrically high if Nu finds product-market fit. If they don’t, the worst case is less than 100 bps of drag on the efficiency ratio for two years, and the core business doesn’t feel it. But if they succeed, Nu enters a whole new era in the world’s largest retail banking market.
Velez has been calling these expansions “call options” since Mexico was the new market. The Mexico call option has already turned out to be worth several billion dollars. Colombia is still vesting but looking promising. The US is a much harder market with stronger digital competition, but with that asymmetry comes huge potential upside.
There was an interesting question on the earnings call in this context. The question was why Brazilian investors are more constructive on the Nu story, including the US thesis, while foreign investors are very skeptical. It also hit home because when I talk about this potential expansion with Americans, they are either very enthusiastic (a minority) or very skeptical. CEO David Velez:
Every time we’ve launched a new country, the locals have been skeptical. When we launched in Brazil, the locals were very skeptical. When we launched in Mexico, the locals were very skeptical... if you’re a local by definition, it’s very hard for you to reimagine how things can happen differently. You are too consumed by the status quo.
That’s a very interesting answer on several levels. As NU is an innovator, the typical consensus is that they do not stand a chance. “Not here, not in this market.” That’s what most locals think. If you are American, maybe that’s what you think right now. And I understand that for sure. If Nu were to expand to Belgium, I might have the same reaction. It’s also why incumbents in any market consistently underestimate what a new player, with a new model, can do. It’s basically a summary of the Nu story for thirteen years already.
Small And Medium-Sized Enterprises
One analyst asked about SMEs. David Vélez:
I actually think this is probably one of the most underappreciated opportunities we have at Nu. We should be speaking more about it, but we’re not. The reality is we’ve kind of silently have built the largest SME base in Brazil with our 5 million SME customers effectively built with 0 customer acquisition cost.
5 million SME (Small and Medium Enterprise) customers. At zero customer acquisition cost. That’s crazy. Nu built this by cross-selling its small-business products to its existing personal-banking customers, since a large share of Brazil’s working population also runs a small business. Today, there are over 2 million Nubank SME credit cards in circulation, plus a growing range of secured and unsecured credit lines (some of them using Brazilian government guarantee programs).
In a country where small businesses employ around 70% of the workforce, this is a very interesting option.
AI: From Talking To Doing
Every company is talking about AI right now. A lot of it is theater, buzzword bingo. But Nu’s AI commentary was very specific, and we can check the numbers.
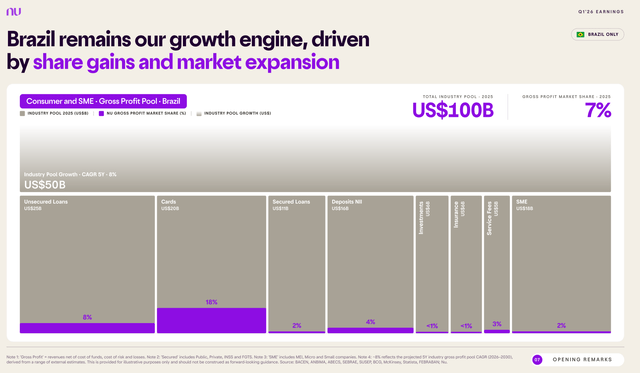
The first phase, AI Assistance, is largely complete now. AI tools have been rolled out to roughly 100% of employees. Engineering throughput is up 50% YoY, weekly token consumption is up around 10x since January and testing cycles are 90% faster. I love that level of detail!
The second phase, Workflow Reinvention, is in progress. AI executes the routine work and humans hold the judgment.
The most concrete example is Pix with AI, which already has more than 10 million MAU (Monthly Active Users). Pix is Brazil’s instant payment system, launched by the central bank in 2020. It is now used by virtually every Brazilian, for everything from paying for a coffee to paying rent. Nu’s AI layer on top of Pix lets customers do things like pay a friend by simply describing in plain language what they want to do, instead of typing in account numbers. That may sound small, but features like this can encourage people to use their Nubank app more.
The third phase is the AI-Native Bank, which is still in its early stages. The AI Private Banker gives customers financial insights, payment guidance, credit advice, and debt resolution, and it’s already at 15M+ MAUs.
Nu’s proprietary foundation models, branded nuFormer, are live for credit card decisioning in Brazil and Mexico, and for unsecured lending in Brazil. CEO David Velez:
We’re now able to use real-time AI valuation for every personal loan request, priced and approved individually based on its predictive net present value in under 1 second.
Let’s go back to where we started: why the stock dropped. The unsecured and credit card lending book is growing 53% YoY, with high ROAs, despite the big losses some love to accentuate.
And now we know how Nu does this. For every loan application, the AI runs the math on what the loan should yield, what the customer is likely to lose, and whether the loan’s lifetime profit is positive. In less than a second. So when you hear bearish takes that Nu takes on riskier customers to grow the book, it’s because Nu is pricing risk more precisely than anyone else in the industry.
The AI productivity is also showing up on the cost side. Remember that CFO Guilherme Marques do Lago said that about a third of Q1’s efficiency outperformance came directly from AI: improvements in customer operations, debt collection, software consolidation, and more disciplined hiring.
In other words, NU uses AI in its core operations, which is extremely important for its positioning.
Below the paywall:
My five new Selling Rules for Nu. I didn’t have any yet, so I built them from scratch. One of them puts a hard number on management’s promise that risk-adjusted NIM goes back up by Q4. If they miss it, I want to know.
The full Quality Score update. Including the one metric where Nu just knocked Adyen off the top spot after years. I didn’t expect that.
My valuation. You can’t value Nu like a bank and you can’t value it like a normal growth stock either. So I built something else for it