
How I value stocks (and how not)
The Lifecycle Valuation Method

I think you know that I value my stocks differently than most. In this article, I'm going a bit deeper into that.
Introduction
While many people only value stocks based on a PE (for individual investors) or a DCF (investors who want to show they are more refined), I value based on the life cycle of companies. You probably know this from my other articles.
The language in this article is as simple and clear as possible, as I always try to do. There are already enough people in the investment world who prefer to proclaim the most complicated theories possible to make you think investing is difficult. I see that mainly as ignorance or an unwillingness to explain it clearly and simply.
The Life Cycle Valuation Method
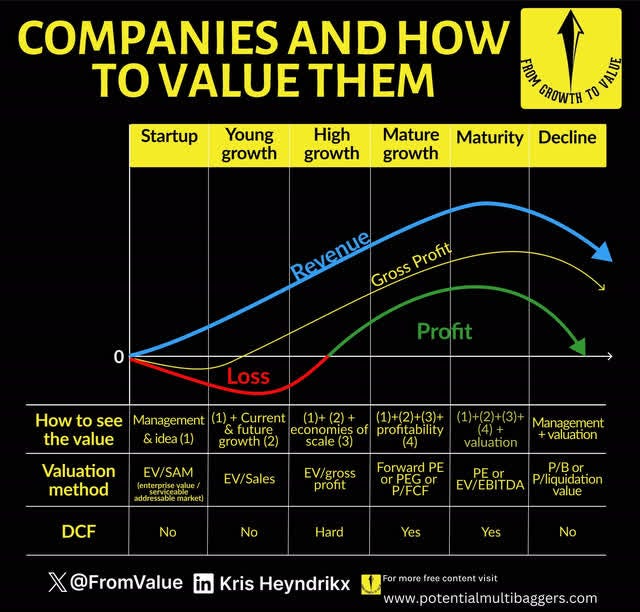
Every company goes through different phases. This ranges from startup to decline, and you can (and should) value the company differently in each phase. I'll repeat this chart throughout the article to make it easier for you, as I go over it in more detail part by part.
My graph shows six phases: startup, young growth, high growth, mature growth, maturity and decline.
Explanation
The graph shows three lines: sales (blue), gross profit (yellow) and net profit (green), which illustrate the financial performance over the life cycle. Here is a detailed explanation, just so everyone understands exactly what's meant by those terms:
Sales: This is the total amount of money from the sale of goods or services. In the startup phase, sales (or revenue, with another word) are low; it grows during the growth phases, peaks in mature growth, and declines in decline.
Gross profit: This is sales minus the cost of goods sold (COGS), or the direct costs of producing the goods. It follows a similar trend to sales, but is lower because it deducts costs.
Net profit: This is gross profit minus all other costs, such as operational costs, interest, taxes and depreciation. In the start-up phase, net profit is often negative (a loss), becomes positive in high growth, peaks in mature growth, and falls in decline.
Valuation methods per phase
The graph contains a table that indicates how a company should be valued in each phase, including what investors should look at and whether a DCF (Discounted Cash Flow) is applicable. So, here it is again.
Below is a detailed explanation for each phase, with the corresponding valuation method.
Startup (EV/SAM)
In this phase, there is often no significant revenue, let alone profit. Investors look at the management and the idea, and value the company based on EV/SAM.
EV (Enterprise Value) is the total value of the company (market capitalization plus debt minus cash), and SAM (Serviceable Addressable Market) is the part of the target market that the company can serve.
This is important for start-ups because they are valued on potential rather than finances. For example, a tech start-up with great market potential can have a high EV/SAM, which indicates that investors believe in its future growth. These companies are for venture capitalists and are not normally listed on the stock exchange.
2. Young growth (EV/Sales)
In this phase, the company is starting to generate sales, but is not yet making a profit. EV/Sales compares the total enterprise value with the revenue, which is useful for growing companies. A lower number can mean that the company is undervalued, but it depends very much on the industry. Software companies often have faster revenue growth and higher margins, and therefore a higher EV/Revenue. These companies are also not yet as often listed on the stock exchange.
We continue with my favorite hunting grounds for Potential Multibaggers: high growth!
3. High growth (EV/Gross profit)
This is where I usually look for potential multibaggers. In this phase, gross profit is a better indicator because it shows the margin and efficiency. This is also the phase in which profits go from negative to positive. But even before a company makes a profit, you can already start looking at the valuation via the total enterprise value (or EV) divided by the profit.
This is, for example, the enterprise value/gross profit of Duolingo.
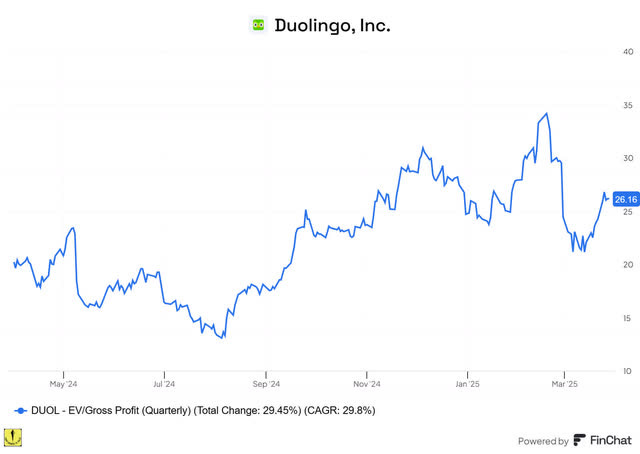
At 26x, Duolingo is not cheap, but also not extremely expensive in relation to its revenue growth (41% in 2024).
I like to divide this number (26) by the revenue growth. Is the result less than 1? Then the share is probably cheap.
Is it between 1 and 2? Then it has been valued more or less fairly, with more towards 2 naturally being more expensive than more towards 1. Duolingo is at 1.57.
More than 2? Then the stock is (very) expensive.
On Finchat, you can easily find EV/Gross profit. If you want a 15% discount, you can use this link. You then pay $288 for a full year. Of course, you can do much more than just look at the EV/Gross Profit on Finchat.
You can ask the AI questions (for example: give me a summary of everything Satya Nadella has said at conferences and earnings calls about Azure over the past three years.)
You can also listen to or read the earnings calls.
You can see what analysts expect the results to be in the next two years.
You can keep track of your portfolio,
etc., etc., etc.
And all that for only €22.2 per month with this link.
4. Mature growth
Let's continue with the phases and valuations. I use mature growth for companies that are already very profitable but still have a turnover growth of around 12% to 17%. Think of Big Tech, for example: Amazon, Google, Microsoft.
Forward PE, Forward PEG, or forward P/FCF
Forward PEG (Price/Earnings-to-Growth) adjusts the PE ratio (or price-earnings) for future growth, calculated as PE divided by the expected annual growth in profit.
Here is an example for Google (GOOGL) (GOOG)

The 2025 PEG is 18.38/11.72 = 1.57
That is fair, because below 1 is cheap, between 1 and 2 is a fair valuation and above 2 is expensive.
The 2026 PEG is 16.12/13.98 = 1.15. Once again, it's fairly valued, but already a bit cheaper.
The 2027 PEG is 13.91/15.9 = 0.88, which is cheap, but also the most uncertain because it is three years in the future.
Conclusion: Google is currently fairly valued.
Sometimes, it can also help to look at the P/FCF (Price to Free Cash Flow).
This is different from profit because with profit, for example, you have to deduct stock-based compensation. That means the shares that the company distributes to its employees. There can also be losses on paper (such as depreciation) or profits on paper (for example, an investment in another listed company whose share price has gone up).
Here too, you can look to the future.
This is the graph of Nvidia, where you can clearly see that the P/FCF is high (45.61) but the future P/FCF (for 2026, therefore) is about the same as Apple and Google at 28.33.
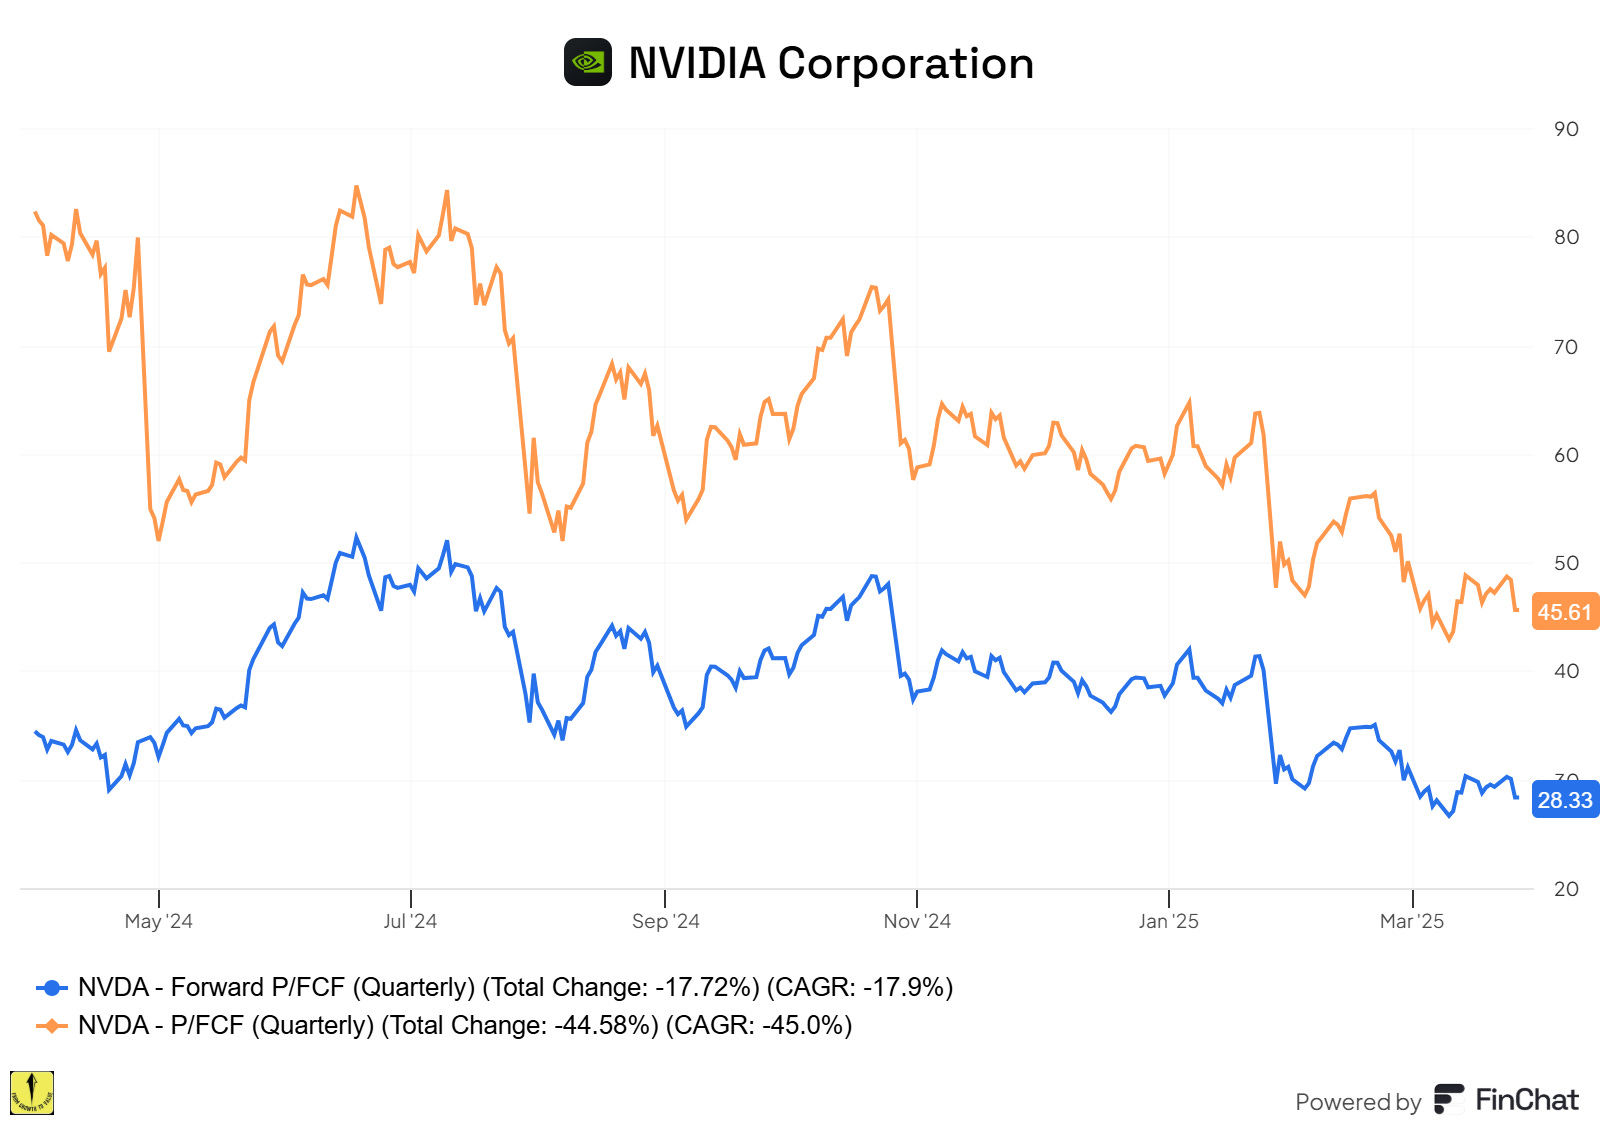
Microsoft (38), Amazon (42) and Tesla (175) are all a lot more expensive based on the 2026 P/FCF.
5. Maturity (PE or EV/EBITDA)
In this phase, companies are stable and profitable.
PE (Price/Earnings) is the most commonly used method, calculated as the share price divided by earnings per share. This much-used metric only applies to companies in maturity. Many investors use P/E for companies in all phases. They will never understand why growth stocks are so “expensive”. They are simply using the wrong yardstick.
EV/EBITDA (Enterprise Value to EBITDA) is useful for comparisons.
EBITDA stands for earnings before interest, taxation, depreciation and amortization. This is sometimes better for companies with a lot of debt. But in general, I don't use this as often, and it is certainly not for companies with large recurring investment costs. These are not included in the depreciation (of tangible fixed assets, such as machinery) and amortization (of intangible fixed assets, such as patents, goodwill, software licenses, intellectual property, etc.).
This is also the phase in which a DCF (discounted cash flow) will work best. It is a model that attempts to assign a fair valuation to a company by simulating the cash flows of the coming years (usually 10 years). This always remains a particularly difficult and subjective exercise, but it works best with stable companies.
6. Decline (P/E or P/Liquidation value)
In this last phase, the company shrinks and investors look at the assets. What is the sum of everything still worth?
P/B (Price to Book) compares the share price with the book value per share, which is relevant for companies with many assets, such as banks. The book value is actually what the company is worth minus its debts.
P/Liquidation Value looks at the value when selling all assets, useful for companies that may be dismantled.
I avoid companies in this phase.
Conclusion
To value a company, knowing its life cycle phase is important. Often, a company will be on the edge of two phases, but that is actually even better because then you have at least two methods to value it. I use the method of both phases. Sometimes, one of the two does not make sense, but often, they both offer valuable information.
By choosing the right method, you can make a better estimate as an investor. It is essential to look not only at current figures but also at future potential and market conditions.
Remember that valuations will always remain subjective, even though many act as if it were an exact science. It is especially difficult to predict the future of growth companies. That is why you must always remain cautious and critical.
I will place the graph here one last time, hoping you understand it completely now.
In the meantime, keep growing!
P.S.: If you are a free subscriber, you mostly don’t see my valuations. If you want to see all the Potential Multibaggers' valuations, you can upgrade right now with A 20% DISCOUNT.
Of course, you get much more. Paid subscribers get Best Buys Now every month, they see all of the transactions I do in my portfolio, they see my portfolio (yeah, it’s real!), they can join the Slack community, they get exclusive new picks and much more. So, don’t hesitate to upgrade.
In the "High growth (EV/Gross profit)" do you divide EV/Gross Profit by Revenue growth or the other way round? I believe the text contradicts with the 1.57 result.